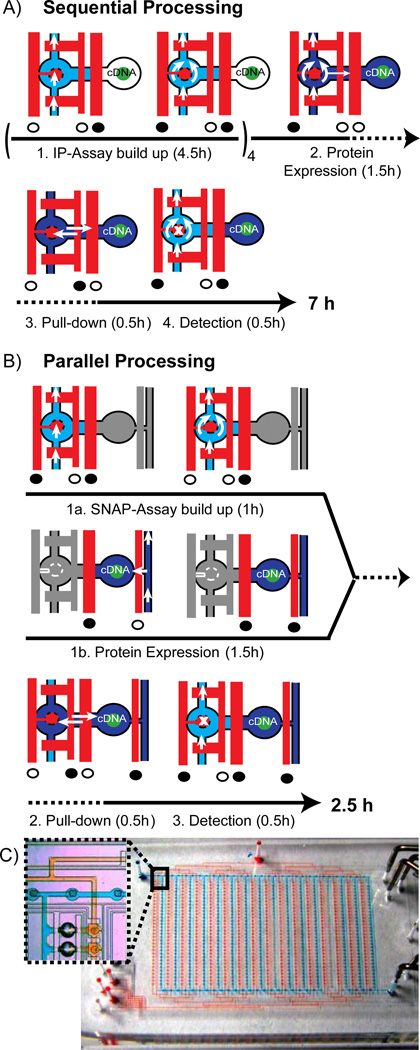
Figure 1.
Process sequence of the protein interaction assay and corresponding flow logics within one unit cell on the sequential (A) and parallel operating (B) microfluidic chip. Blue and red denote the flow layer and control layer of the multilayer PDMS chip. Full and open circles below the control channels indicate the actuated and released state of the valves, respectively. Time lines are given below the pictograms of the corresponding micro-architecture. A) Only one flow circuit is implemented in the first-generation chip. Chemicals to build up the IP assay (light blue), to express bait and prey proteins from spotted cDNA’s (dark blue) and a fluorescently labeled Ab (light blue again) to detect PPI’s are flushed sequentially. The button valve is located on the left-hand side of the unit cell. Process 1 has to be circled four times in order to specifically deposit an Ab in the pull-down area (marked with an “x” in process 4). White arrows indicate the flow direction of the fluids, whereas the double arrows in process 3 indicate passive diffusion of proteins from the place of synthesis to the pull-down area. B) An additional flow circuit was implemented on the next-generation chip to process the first two steps of the PPI assay in parallel (grayed out sections in the state pictograms denote the parallel process). C) Overview image of the next-generation chip with 640 unit cells shown in B. The two independent flow circuits are visualized with red and blue food colors. Inlet shows a zoom version of the inter-layer connector structure for bridging the flow circuits together with two unit cells.

