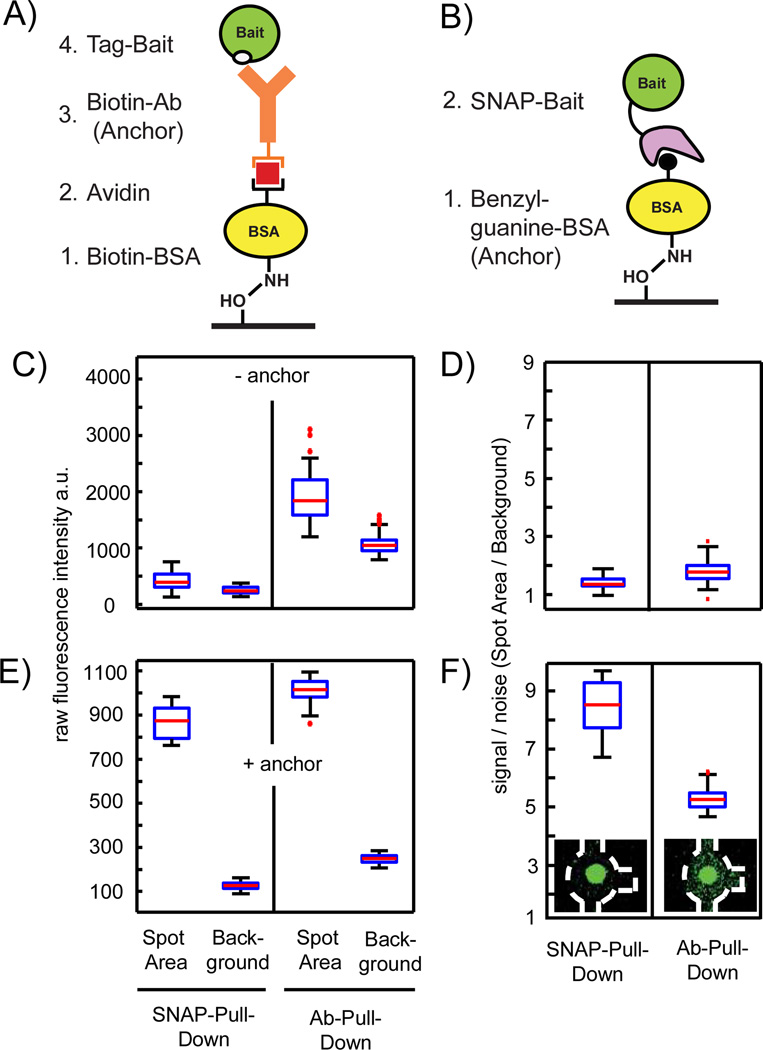
Figure 2.
Redesign process of the chemical architecture of the PPI assay on the chip. A–B) Antibody and SNAP tag pull-down strategies for the bait protein onto an epoxy glass surface, respectively. C) Control measurement to determine background signals from the chemical architecture of the pull-down assay by omitting the anchor molecules. Raw fluorescence intensities are measured within one chip for the fluorescence probe S-GFP-H (1 mg/ml) after flushing through the channels containing either unit cells with BSA-biotin/Avidin/BSA-biotin or BSA on the pull-down area under the button. D) Corresponding signal-to-noise levels (spot area/background) to the data in C. E) Repeat of the control experiment with anchor molecules. Raw fluorescence intensities are measured within one chip for the fluorescence probe S-GFP-H (1 mg/ml) after flushing over the fully assembled IP and SNAP pull-down arrays. F) Corresponding signal-to-noise levels to the data in E. Insets showing exemplarily fluorescent images of the corresponding unit cell on the chip (outlined with the dashed white line) after the S-GFP-H was pulled down. A total of 160 individual pull-down areas per condition were evaluated for all boxplots.

