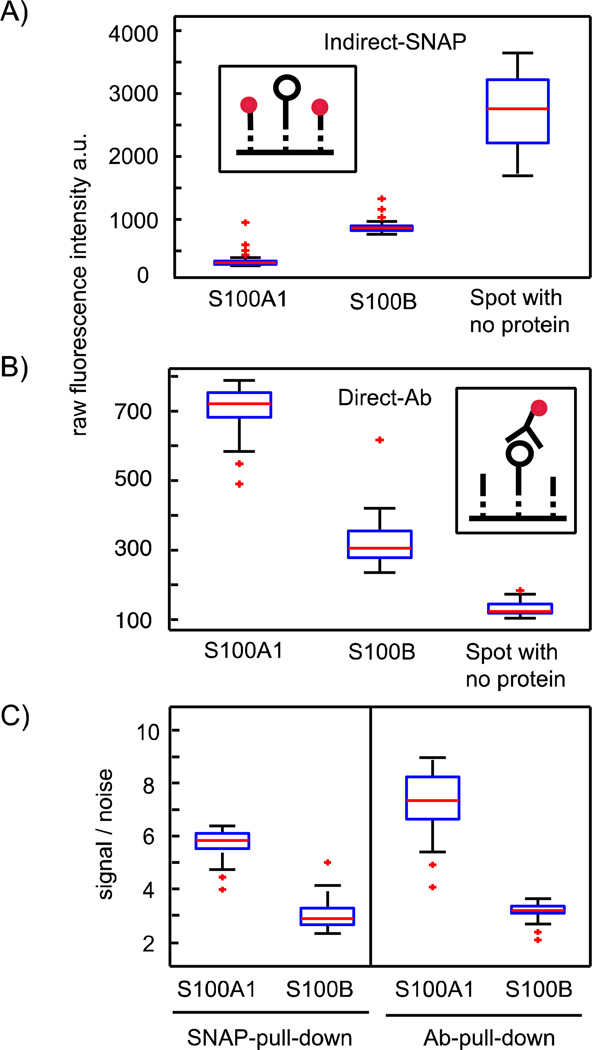
Figure 3.
Comparison between the indirect and direct detection method of bait proteins on the SNAP pull-down area after in vitro expression. A) The inset illustrates the indirect methods to determine bait concentrations on the pull-down areas. The black open circle denotes the bait, dotted lines denote the BG anchor places, and red dots denote the fluorescence probe. The probe is able to bind the remaining free BG anchor places after the bait is pulled down. The boxplot shows the raw fluorescence data (λem = 509 nm) of the fluorescence probe, S-GFP-H (1 mg/ml), on the pull-down areas in unit cells with either in vitro expressed S100A1, or S100B, or no protein. B) The inset illustrates the direct methods to determine bait concentrations on the pull-down areas. The black open circle denotes the bait, dotted lines denote the BG anchor places, and red dots denote a fluorescently labeled antibody specific for a bait tag. The boxplot shows the raw fluorescence data (λem = 647 nm) for the fluorescently labeled antibody specific for the bait-tag sequence in detection areas in unit cells with either in vitro expressed S100A1, or S100B, or no protein (Ab-detection: anti-6×His). C) Signal-to-noise ratio obtained from the two reference methods in A and B, where, for the indirect method, the value was inverted. For all boxplots, 48 single measurements on the chip were used and all raw fluorescence data points were correct by subtraction of the local background.

