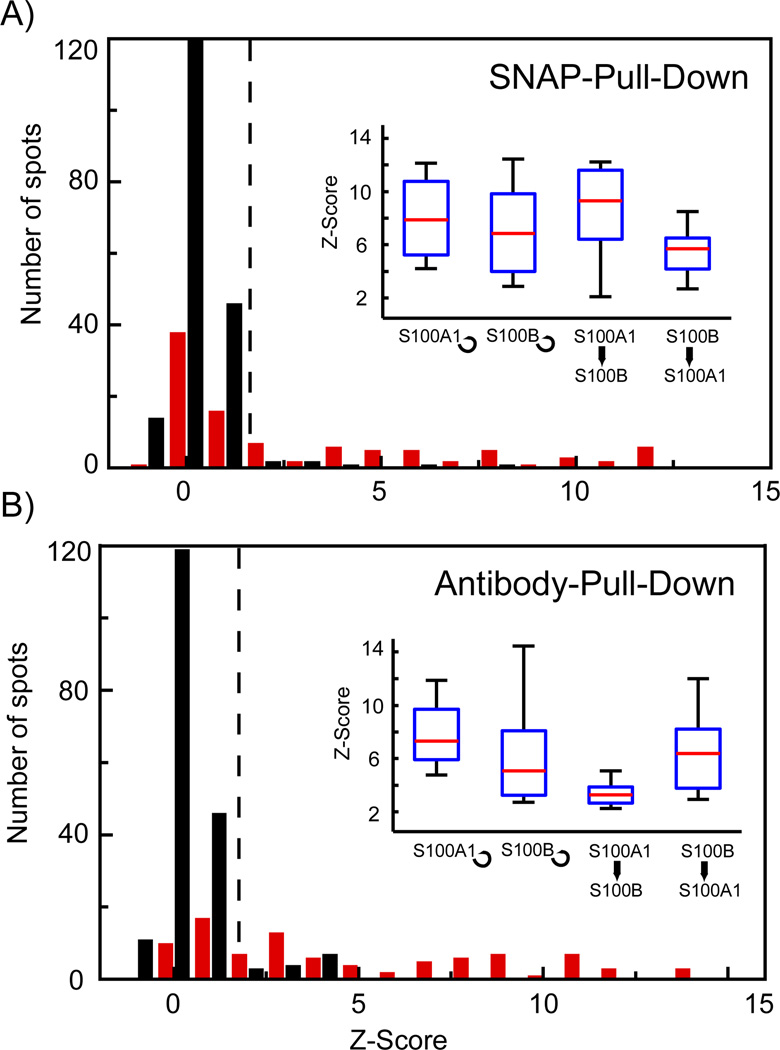
Figure 4.
Comparison between protein-protein interaction measurements performed on microfluidic chips with SNAP or IP chemical architecture. A and B) Histograms of the Z-Scores obtained for the self- and cross-interactions of S100A1 and S100B on chips with SNAP and IP chemical architecture, respectively. Red and black bars denote the positive protein interaction set and negative control set. The positive-interaction set comprised 24 repeats for each of the four test interactions and the control set comprised 192 spots including no bait, no prey, and no protein controls. Insets in A and B show boxplots for the separated tested protein interactions with a Z-Score higher than 2, which is used as threshold value for identification of positive protein-protein interactions (dotted line in the histograms).

