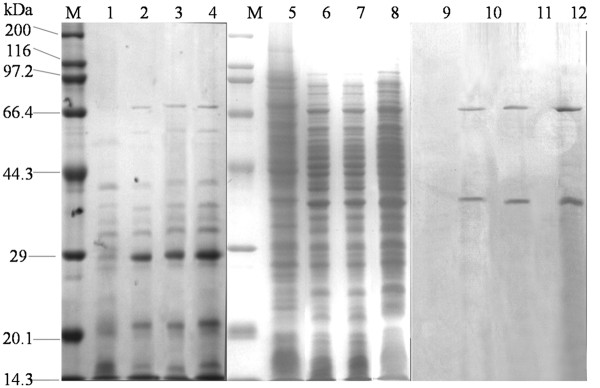
Figure 3.
OtrC heterologous expression in E. coli. Cultures of cells were grown and induced by 1 mM IPTG as described in the Materials and Methods. Cells were resuspended in 500 mM Tris–HCl (pH 7.0) buffer, and cell disruption was performed by ultrasonic waves; the total membrane fractions were harvested by centrifugation at 125,000 rpm at 4°C for 1 h. 12% SDS-PAGE analysis was performed with a high-molecular-weight protein marker (M), 80 μg total membrane fractions of E. coli/pET28a (lane 1), 40 μg, 60 μg and 80 μg total membrane fractions of E. coli/pETC02 (lane 2,3 and 4), 120 μg total cell protein of E. coli/pET28a (lane 5), 60 μg,80 μg and 120 μg total cell protein of E. coli/pETC02 (lanes 6,7 and 8). Western blot analysis was performed with equal volumes of total cell protein of E.coli/pET28a (lane 9) and E. coli/pETC02 (lanes 10, 11 and 12), His-tag mouse and peroxidase-conjugated goat anti-mouse antibodies were used for specific band detection.

