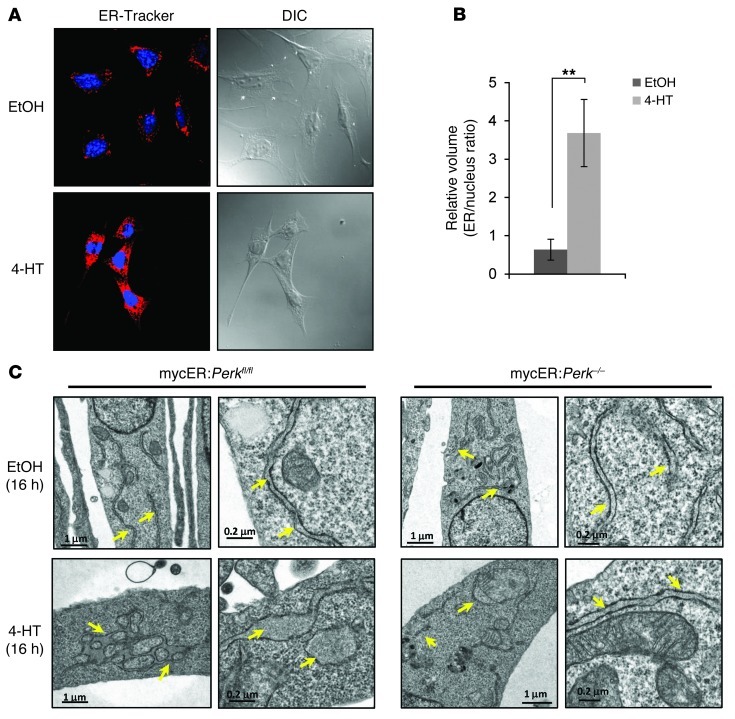
Figure 2. c-Myc expression induces PERK-dependent ER expansion.
(A) mycER:Perkfl/fl MEFs were treated with EtOH or 4-HT, stained with the ER-specific dye ER-Tracker, and analyzed by fluorescence confocal microscopy (cells were counterstained with DAPI; original magnification, ×400). DIC, differential interference contrast. (B) Relative ER volume (ER/nucleus) of cells stained in A. **P < 0.05, Student’s 2-tailed t test. (C) mycER:Perkfl/fl and mycER:Perk–/– MEFs were treated with 4-HT, and ER structures were examined by electron microscopy. Scale bars: 1.0 μm (2 left panels); 0.2 μm (2 right panels) for each cell line.

