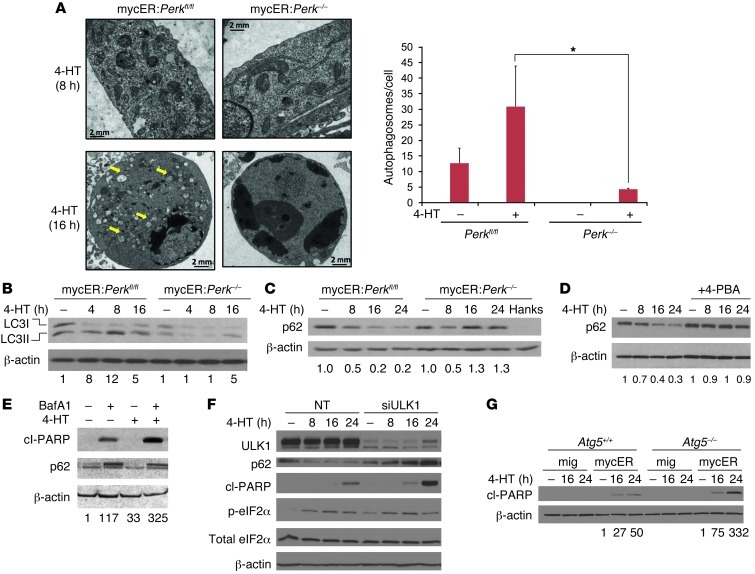
Figure 4. PERK-dependent autophagy promotes cell survival in cells expressing c-Myc.
(A) MEFs were treated with 4-HT, then analyzed for autophagosome formation by electron microscopy (left panel; scale bars: 2 μm), and autophagosomes were quantified (right panel: 3–8 cells per treatment; *P < 0.05, 1-tailed Student’s t test). (B) MEFs were treated with 4-HT and analyzed for processing of the autophagic marker LC3 with immunoblotting (blots are representative of 3 independent experiments; values represent the ratio of LC3II to LC3I and are shown as fold change relative control). (C) MEFs were treated with 4-HT, and immunoblotting was performed for degradation of p62 (Hanks solution used as positive control). (D) mycER:Perkfl/fl MEFs were treated with 4-HT in the presence or absence of 4-PBA, and immunoblotting was performed for p62. (E) mycER:Perkfl/fl MEFs were treated with bafilomycin A1 (BafA1; 50 nM) and 4-HT, and cleaved PARP and p62 levels were analyzed. (F) mycER:Perkfl/fl MEFs were transfected with non-targeting (NT) or ULK1 siRNA, treated with 4-HT, and analyzed for autophagy and apoptosis. (G) Atg5+/+ and Atg5–/– MEFs were infected with control (mig) or mycER retrovirus and treated with 4-HT to detect cleaved PARP (β-actin was used as a loading control; representative of 2 independent experiments; values below blot represent total pixel intensity of cleaved PARP normalized to actin for each lane and are shown as fold change relative to no tetracycline control).

