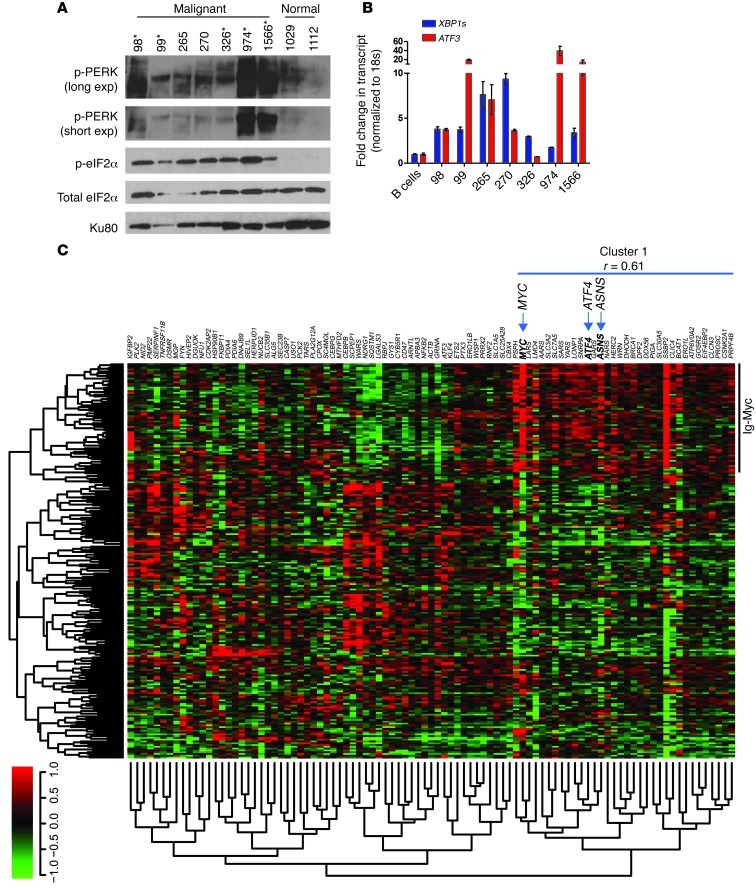
Figure 6. UPR activation in human lymphomas.
(A) Primary human B cells, obtained from lymphoma patients and normal donors, were analyzed for UPR activation by p-eIF2α and p-PERK (Ser713) levels (*samples with Myc translocation confirmed by FISH analysis [note: Myc translocation was confirmed for patient 1566, who was diagnosed with AML]; all other samples were confirmed for Burkitt’s lymphoma morphology and are presumed to contain Myc translocations). (B) Primary human B cell samples were analyzed for downstream UPR activation by qPCR of XBP1s and ATF3 (average of 3 independent qPCR reactions). (C) An ER stress response signature clusters c-Myc–overexpressing B cell lymphomas. Raw data were downloaded from the NCBI GEO repository (GSE4475). The genes listed were derived from an ER stress response signature defined using ER stressors and genetic knockouts by Harding et al. (49). Normalized probe signals for the genes listed were clustered using a Pearson complete correlation coefficient, with a significance threshold for each hierarchical subcluster set at P < 0.05. Cases annotated as Ig-Myc were defined as such by fluorescence in situ hybridization in the original expression array study. Expression signals are depicted using pseudocoloring, in which expression for each gene is shown as high (red) or low (green).

