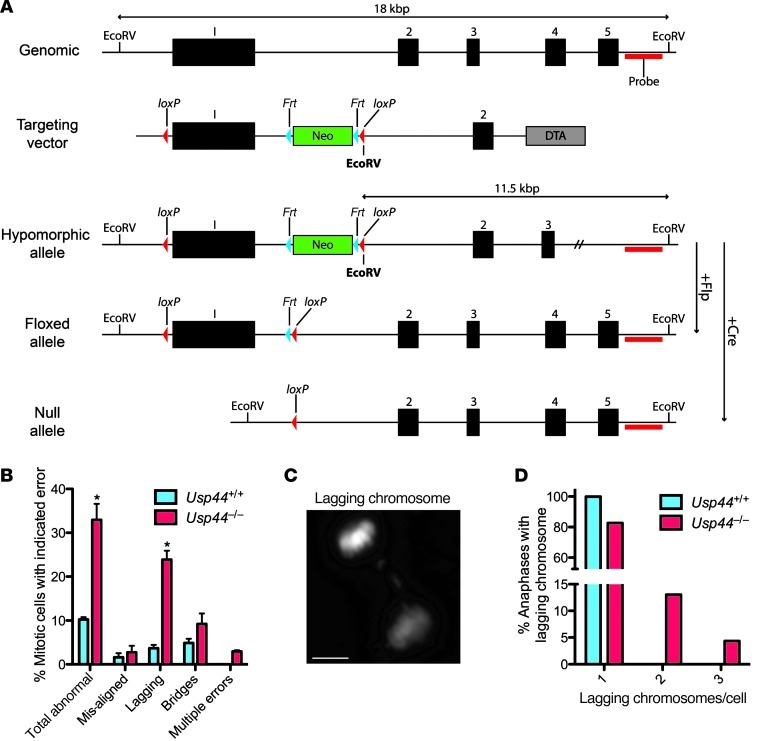
Figure 1. USP44 loss leads to chromosome mis-segregation.
(A) Strategy for targeting the Usp44 gene in mice. The Usp44 gene with indicated EcoRV sites, location of the Southern probe, the targeting vector with NeoR, Frt and loxP sites, and the resulting hypomorphic floxed and null alleles. (B) MEFs of the indicated genotypes were transduced with H2B-YFP to visualize chromosomes and followed through mitosis by live-cell microscopy. Values represent the mean ± SEM of 3 independent lines per genotype (n = 137 Usp44+/+ and n = 91 Usp44–/–). (C) Still image of lagging chromosome captured from live-cell time-lapse microscopy from Usp44–/– MEFs transduced with H2B-YFP. Scale bar: 5 μm. (D) Cells encountering a lagging chromosome were scored for the number of chromosomes involved in the error. Graph represents the percent incidence of each error in the overall population of cells observed. *P < 0.05, 2-tailed unpaired t test.

