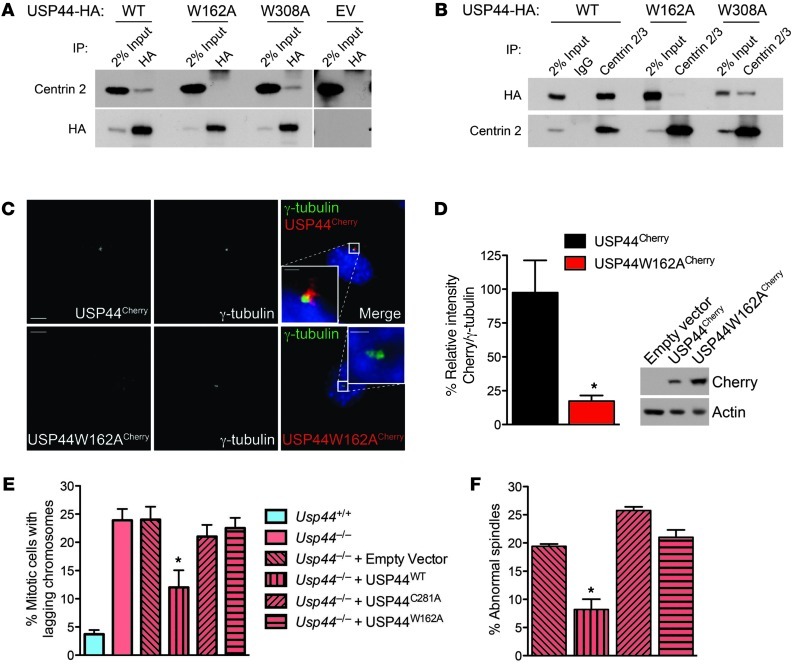
Figure 6. The USP44-centrin complex is required in order to prevent chromosome mis-segregation.
(A and B) MEFs transduced with HA-tagged wild-type USP44 (WT), USP44W162A (W162A), USP44W308A (W308A), or empty vector (EV) were subjected to immunoprecipitation using the indicated antibodies. Precipitates were immunoblotted using antibodies against the indicated proteins. (C) Confocal immunofluorescence microscopy was performed on methanol-fixed MEFs transduced with USP44WTCherry or USP44W162ACherry using antibodies against the indicated proteins. Scale bar: 5 μm; insets, 1 μm. (D) Quantitation of USP44Cherry and USP44W162ACherry at centrosomes. Images were captured with identical settings, and the cherry signal was normalized to that of γ-tubulin. n = 11 cells from each genotype. Graph represents the mean ± SEM. (E) MEFs of the indicated genotype were transduced with empty vector or the indicated USP44 constructs followed by live-cell microscopy. Chromosomes were visualized through the expression of H2B-YFP. The graph represents the mean ± SEM of 3 lines per genotype. n = 71–137 total cells per condition. (F) Cells treated as in E were fixed and stained with α- and γ-tubulin, followed by confocal microscopy. Spindles with poles off axis were scored as abnormal. The graph represents the mean ± SEM of 3 lines per genotype. *P < 0.05, 2-tailed unpaired t test.

