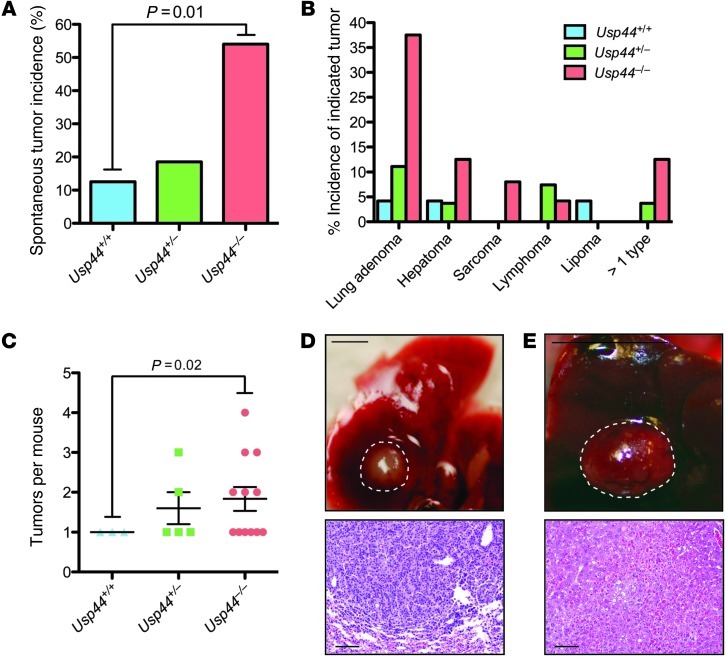
Figure 7. USP44 is a tumor suppressor.
A. Mice of the indicated genotypes (n = 27, 27, and 25 for Usp44+/+, Usp44+/–, and Usp44–/–, respectively), were sacrificed at 15 months of age and were dissected and scored for visible tumors. Graph represents the percent incidence of spontaneous tumors in the overall cohorts. The P value was calculated using Fisher’s exact test. (B) Tumor spectrum seen in mice from A. All tumor classifications were confirmed by histopathology. The graph represents the percent incidence of each tumor type in the overall cohorts. (C) Graph represents the total number of tumors per mouse, regardless of histology (mean ± SEM) including all that had at least 1 tumor. The P value was calculated using a 2-tailed 1-sample t test. (D and E) Gross (scale bars: 1 mm) and microscopic (scale bars: 50 μm) appearance of representative lung adenoma (D) and liver hepatoma (E) from Usp44-null mice.

