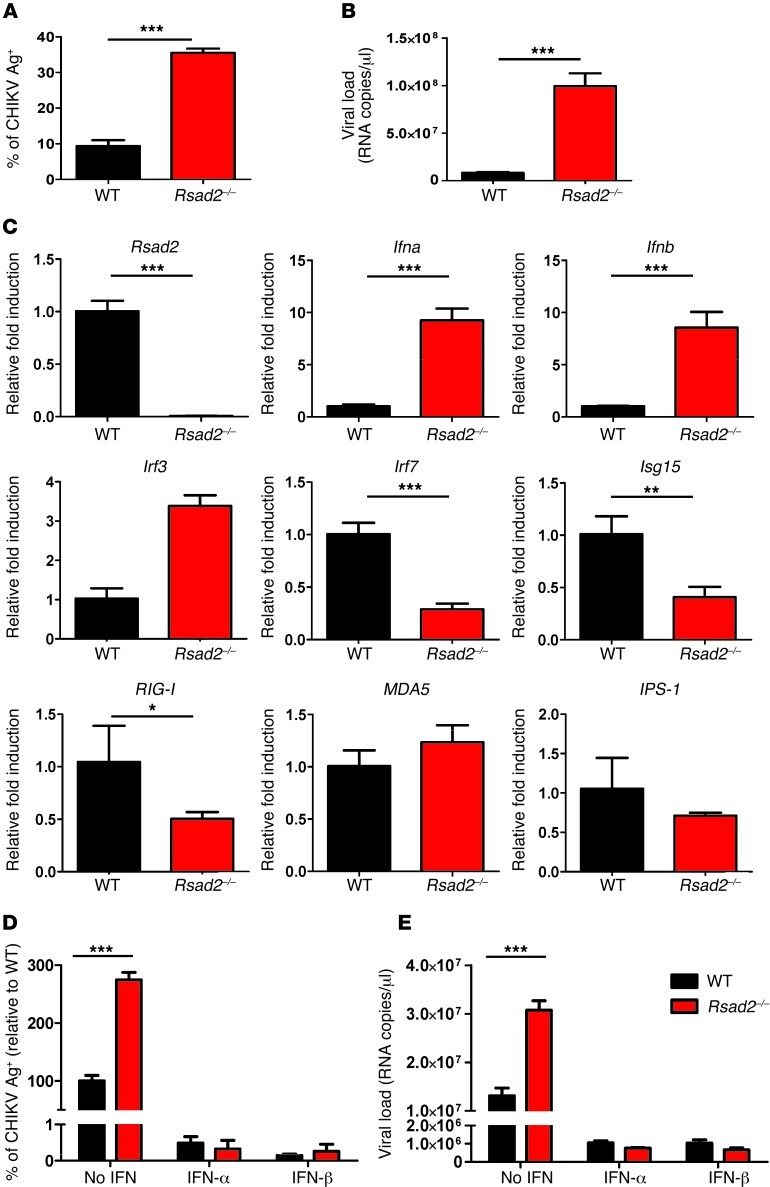
Figure 7. Viperin controls CHIKV infection in mice.
(A) Primary tail fibroblasts isolated from WT and Rsad2–/– mice were infected with CHIKV (MOI 10) or were mock infected (control) for 12 hours. Percent CHIKV Ag+ cells was measured by flow cytometry. Data (mean ± SD) are representative of 3 independent experiments. ***P < 0.005, unpaired t test. (B) Viral load was determined by qRT-PCR and presented as mean ± SD (n = 3). ***P < 0.005, unpaired t test. (C) qRT-PCR was used to determine expression of the indicated genes in fibroblasts after infection. Data are fold expression ± SD relative to WT. ***P < 0.005, **P < 0.01, *P < 0.05, unpaired t test. (D) WT and Rsad2–/– fibroblasts were pretreated with IFN-α or IFN-β (1,000 IU/ml) for 4 hours before infection with CHIKV (MOI 10) for 12 hours. Mock infection was used as control. Percent CHIKV Ag+ cells was measured as described in A; data are mean ± SD of percent CHIKV Ag+ cells relative to untreated WT (n = 3). ***P < 0.005, unpaired t test. (E) Viral load was quantified as described in B and presented as mean ± SD (n = 3). ***P < 0.005, unpaired t test.

