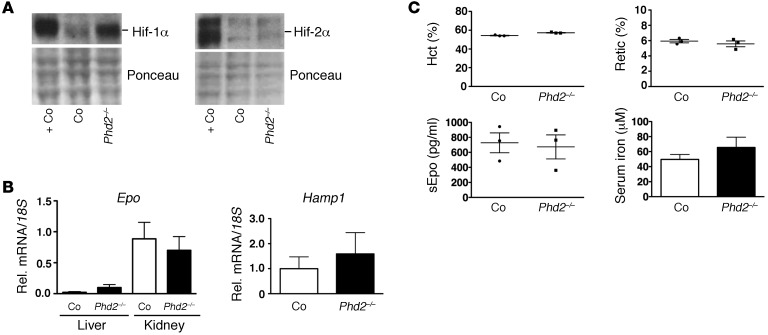
Figure 3. Hepatocyte-specific inactivation of Phd2 does not suppress Hamp1.
(A) Hif-1α and Hif-2α protein levels in Phd2–/– livers. Ponceau staining is used to assess for equal protein loading. +Co, positive control sample obtained from Vhl–/– livers. (B) Hepatocyte-specific inactivation of Phd2 does not increase Epo mRNA and does not suppress Hamp1 mRNA levels in Phd2–/– livers. Shown are relative mRNA expression levels normalized to 18S ribosomal RNA in mutant and control livers. Corresponding renal Epo mRNA levels are shown for comparison (n = 3). (C) Hct, reticulocyte counts, and serum Epo and serum iron levels in control and Phd2 mutant mice (n = 3 each). Shown are mean values ± SEM. For statistical analysis, mutants were compared with controls.

