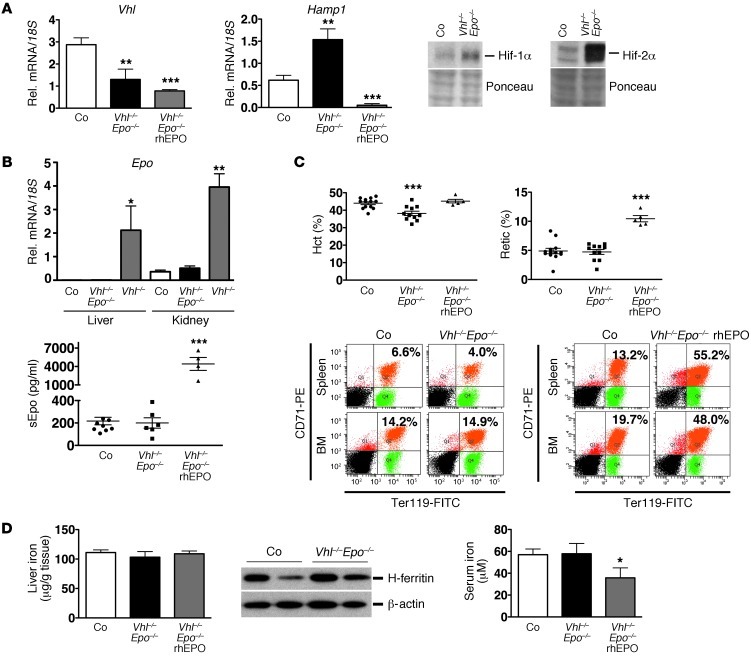
Figure 4. Hif-mediated Hamp1 suppression is Epo dependent.
(A). Hepatic Vhl and Hamp1 mRNA levels in control, Vhl/Epo–/–, and Vhl/Epo–/– mice treated with rhEPO (n = 6, 6, and 5, respectively). Right panel shows Hif-1α and Hif-2α protein levels in Vhl/Epo–/– livers. Ponceau staining is used to assess for equal protein loading. (B) Epo levels in control, Vhl/Epo–/–, and Vhl–/– livers and kidneys (n = 6, 6, and 3, respectively). Bottom panel shows serum Epo concentrations in control, Vhl/Epo–/–, and Vhl/Epo–/– mice treated with rhEPO (n = 10, 6, and 4, respectively). (C) Hct and reticulocyte counts in control, Vhl/Epo–/–, and rhEPO-treated Vhl/Epo–/– mice and representative FACS analysis plot of CD71/Ter119-stained BM and spleen cells from 1 control and 1 mutant mouse. Percentages of CD71hiTer119hi-positive cells are indicated in the right upper quadrant. (D) Liver (n = 8, 4, and 5, respectively) and serum iron concentrations (n = 10, 6, and 4, respectively) in control, Vhl/Epo–/–, and Vhl/Epo–/– mice treated with rhEPO, and H-ferritin protein levels in control and Vhl/Epo–/– livers. β-actin served as loading control. Shown are mean values ± SEM. *P < 0.05; **P < 0.01; ***P < 0.001, for comparisons of mutants with controls. Vhl/Epo–/– (rhEPO), Vhl/Epo double-mutant mice treated with rhEPO.

