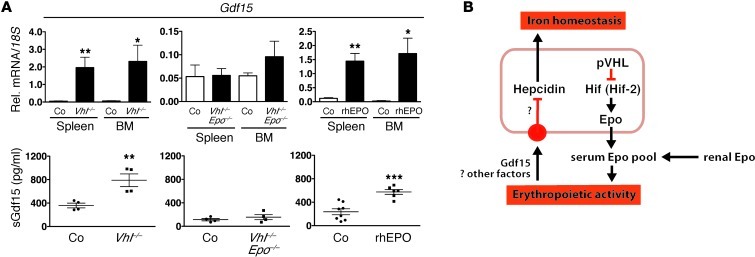
Figure 6. Elevation of serum Gdf15 in Vhl–/– mice is Epo dependent.
Gdf15 mRNA levels in total spleen and BM cell isolates and corresponding serum Gdf15 levels in pg/ml. (A) Left panels, Vhl–/– mutants and Cre– littermate controls (n = 3 and 4, respectively for mRNA analysis; for serum analysis, n = 4 each); middle panels, Vhl/Epo–/– mice and Cre– littermate controls (n = 4 each); right panels, WT mice treated with rhEPO or with vehicle (for mRNA analysis, n = 3 and 4, respectively; for serum analysis, n = 6 and 8, respectively). Shown are mean values ± SEM: *P < 0.05; **P< 0.01; ***P < 0.001, for comparisons of mutants with controls. (B) Schematic depiction of Hif’s role in the regulation of hepcidin transcription in hepatocytes. C–, Cre-negative littermate control mice or vehicle-treated WT mice.

