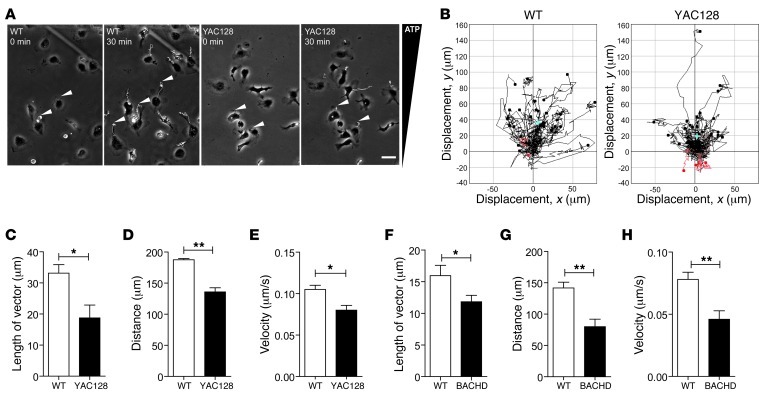
Figure 2. Mutant htt expression in microglia diminishes the extension of microglial processes toward ATP.
(A) Microglia from WT and YAC128 mice were placed in a gradient of ATP (0–100 μM) in a Dunn chemotaxis chamber and imaged by phase contrast, time-lapse microscopy. Microglia from WT mice show robust extension of processes (arrowheads) toward the ATP gradient (white lines indicate the movement of the leading edge of cell over 30 minutes); the response of YAC128 microglia is significantly decreased. (B) Chemotaxis plots showing tracks and distance (μm) traveled by the leading edge of WT (left) and YAC128 (right) microglia toward ATP after 30 minutes. Values are plotted in the x and y directions relative to the starting location. Black lines indicate a net extension; red lines indicate a net retraction; light blue cross indicates the mean length of the vector. (C–H) Summary of the mean length of the vector (C and F), mean velocity (D and G), and mean accumulated distance (E and H) of WT and YAC128 microglia (n = 2; 3 independent experiments), and WT and BACHD microglia (n = 6; 5 independent experiments). For each sample in each experiment the processes of at least 30 microglial cells were analyzed. Values are mean ± SEM. *P < 0.05, **P < 0.01 (t test). Scale bar: 50 μm.

