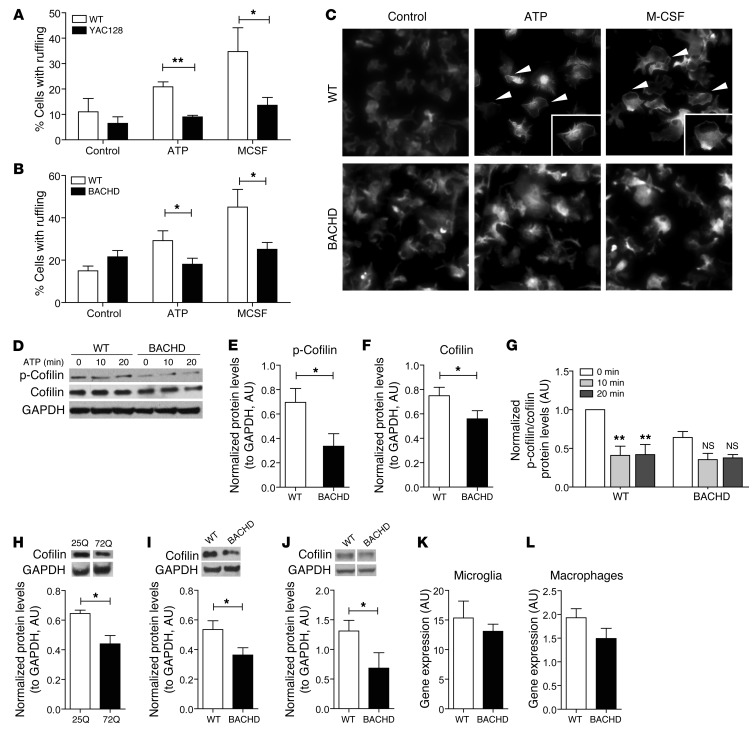
Figure 6. Mutant htt expression in microglia decreases membrane ruffling and cofilin levels.
Primary microglia from (A) YAC128 and (B) BACHD mice have less membrane ruffling upon stimulation with ATP (100 μM) and M-CSF (100 ng/ml) than WT microglia. Membrane ruffling did not differ in HD microglia treated with M-CSF and untreated cells. Cells were stained with rhodamine-phalloidin, and the percentage of cells with membrane ruffling was quantified within 10 minutes. Values are mean ± SEM of 3 independent experiments. *P < 0.05, **P < 0.01 (t test). (C) Representative images of WT and BACHD microglia stained with rhodamine-phalloidin (total original magnification, ×200). Membrane rufflings (white arrows) are indicated as distinct white lines at the perimeter of the cells, while cells without membrane ruffling have dispersed phalloidin staining. Inset is a ×1.5 zoom of the cell of interest in the corresponding image. (D) Western blot analysis, performed with antibodies against p-cofilin, cofilin, and GAPDH, of homogenates from primary microglia isolated from BACHD mice at selected times after stimulation with ATP (100 μM). (E and F) p-Cofilin and cofilin baseline levels are lower in primary BACHD than WT microglia. (G) BACHD microglia do not have the robust dynamic change in p-cofilin upon ATP stimulation. Data were quantified as the ratio of p-cofilin to cofilin, both normalized to GAPDH levels. (H–J) Western blot analysis with an antibody against cofilin shows lower cofilin protein levels in (H) N9 microglial cell lines expressing htt 72Q, (I) BACHD brain homogenates, and (J) BACHD peritoneal macrophages than in controls (*P < 0.05). Protein levels were normalized to GAPDH levels. (K and L) Cofilin mRNA levels are not significantly decreased in primary BACHD microglia and BACHD peritoneal macrophages. Values are mean ± SEM. n = 3–5 biological replicates (t test).

