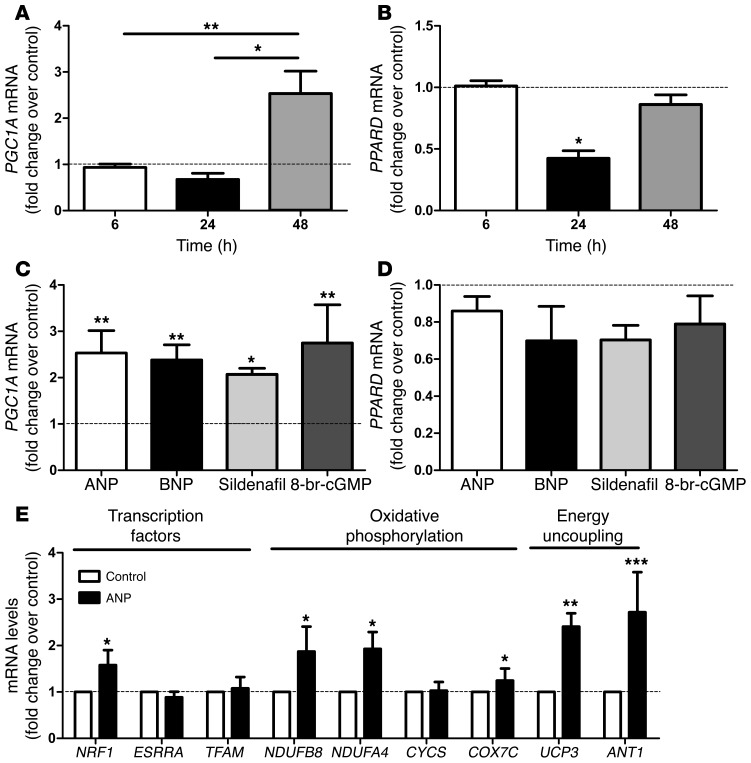
Figure 2. NP induces PGC-1α and mitochondrial oxidative genes in human primary myotubes.
Time course of (A) PGC1A and (B) PPARD gene expression in response to treatment with 10 nM ANP (n = 6). (C) PGC1A and (D) PPARD gene expression in response to 10 nM ANP/BNP, 1 μM sildenafil, and 1 mM 8-bromo-cGMP after 48-hour treatment (n = 6). (E) Changes in transcription factors and OXPHOS and energy uncoupling genes in response to 48-hour treatment with 10 nM ANP (n = 6). *P < 0.05, **P < 0.01, ***P < 0.001 versus control.

