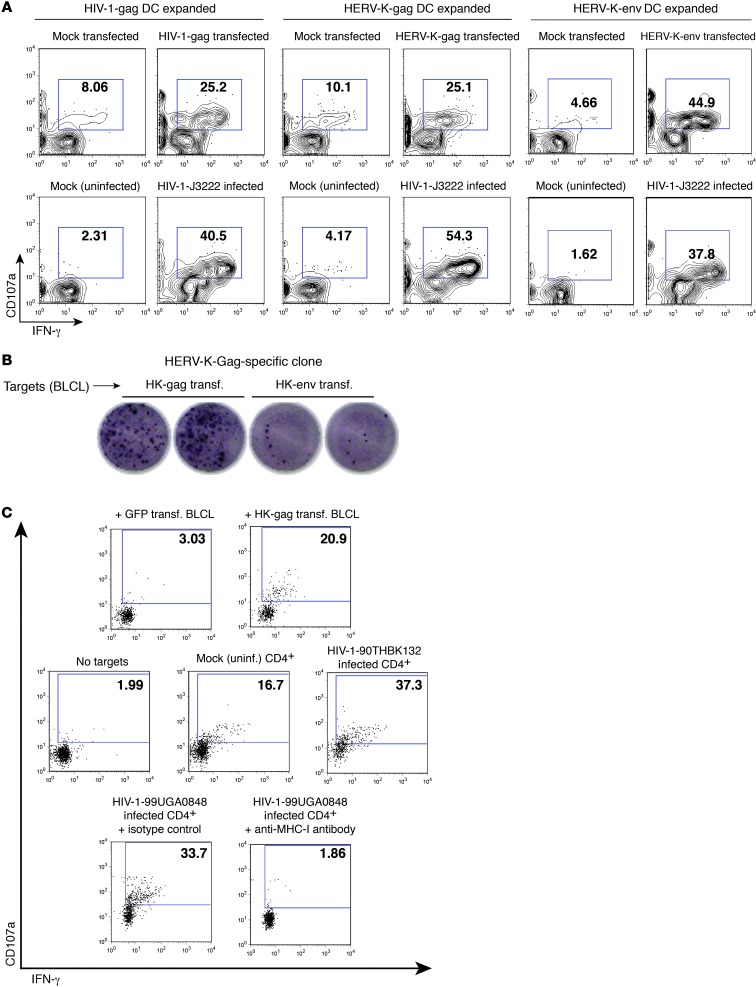
Figure 11. Recognition of HIV-1–infected cells by additional HERV-K(HML-2)–specific lines and clones.
HIV-1-Gag–, HERV-K-Gag–, and HERV-K-Env–specific CD8+ T cell lines were established by a 9-day coculture of PBMCs with autologous mature DCs that had been transfected with codon-optimized mRNA encoding the corresponding antigen. (A) Expanded cell lines were cocultured with autologous CD4+ T cells that had been transfected with mRNA or maintained as a mock transfection control or had been infected with the primary isolate of HIV-1 J3222 or maintained as a mock-infected control. Shown are flow cytometry data, gated on the CD8+ lymphocyte population. (B) DC-expanded cell lines were plated at limiting dilution on irradiated feeder cells, then screened for antigen specificity by coculture with autologous BLCLs that had been transfected with the indicated mRNAs. Shown are IFN-γ ELISPOT data for 1 clone derived from the HERV-K(HML-2)-Gag expansion, exhibiting recognition of gag transfected BLCLs. (C) The HERV-K(HML-2)-Gag–specific CD8+ T cell clone from B was reexpanded. Shown are flow cytometry data, gated on CD8+ lymphocytes, for HERV-K(HML-2)–specific T cell clones cocultured for 6 hours with autologous BLCLs that had been transfected with GFP (negative control) or HERV-K(HML-2)-Gag encoding mRNA (top panel); no targets or autologous CD4+ T cells that had been infected with HIV-1-90TH_BK132 or mock infected (middle panel); or autologous HIV-1-99UG_A0848M1–infected CD4+ T cells in the presence of either an anti–MHC-I blocking antibody or an isotype control (bottom panel). Panels in C present results from 3 separate experiments performed during the same week, with the same expansion of clones. (A and C) Numbers represent percentages of CD107a+ cells.

