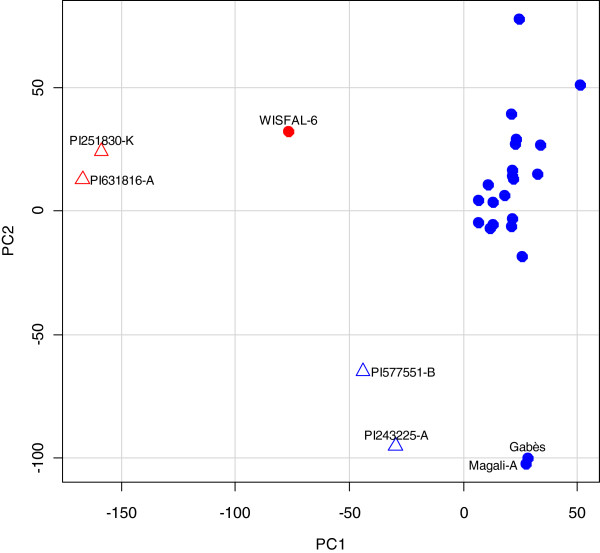
Figure 4.
Plot of the first two principal components from a principal components analysis of SNP variation among 27 alfalfa genotypes. Blue solid circles represent tetraploid sativa; red solid circle represents tetraploid falcata; blue triangles represent diploid caerulea; red triangles represent diploid falcata.

