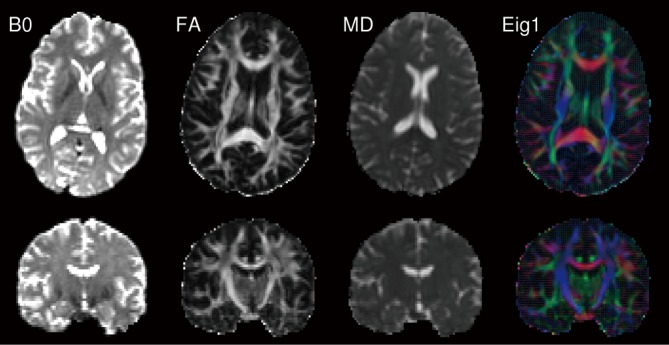
Figure 7.

Diffusion tensor imaging. The non-diffusion weighted scan (B0) is shown on the left, followed by the fractional anisotropy (FA) image demonstrating higher values in white matter tracts then the mean diffusivity (MD) image with elevated values in the CSF. The final column shows the direction of principal eigenvector (Eig1) both in color-coded form (red = left/right, green=anterior/posterior, blue=superior/inferior) and in vector form (line segments)
