Abstract
The purpose of the present study was to determine the effect of Akt gene ablation on Akt/Forkhead Box O (FOXO) signaling and atrogene expression. This was accomplished by studying wild-type (WT) and isoform-specific Akt knockout (Akt1−/− and Akt2−/−) mice. The ability of insulin to promote Akt phosphorylation on Ser473 was significantly lower in extensor digitorum longus (EDL) and soleus muscles from Akt1−/− and Akt2−/− mice compared with WT mice. Total Akt1 protein levels were significantly lower in EDL muscles of Akt2−/− mice compared with WT mice, a process that appears to be posttranscriptionally regulated as Akt1 mRNA levels were unchanged. The loss of Akt1 protein in EDL muscles of Akt2−/− mice does not appear to be due to insulin resistance because 4 mo of a high-fat diet failed to reduce Akt1 protein levels in muscles of WT mice. Although FOXO3a phosphorylation and atrogin-1 expression were unaltered in muscles of Akt1−/− and Akt2−/− mice, the expression of the atrogenes Bnip3 and gabarapl were significantly elevated in muscles of both Akt1 and Akt2 knockout mice. Finally, the expression of striated activator of Rho signaling was significantly increased in muscles of Akt2−/− mice compared with Akt1−/− and WT mice. Our results demonstrate that the ablation of Akt isoforms disassociates insulin action and Akt/FOXO signaling to atrogenes.
Keywords: signal transduction, atrophy, sarcopenia, protein kinase b, glucose metabolism
akt [also called protein kinase B (PKB)] is a critical insulin signaling molecule that regulates muscle mass, in part, by suppressing protein degradation (4, 12). Akt appears to suppress protein degradation by orchestrating a decrease in the expression of genes necessary for ubiquitin-proteasome and autophagy lysosomal-dependent proteolysis (4, 14). One mechanism by which Akt reduces the expression of genes involved with protein degradation is the phosphorylation and subsequent nuclear exclusion of the forkhead box transcription factor FOXO. Recently, several FOXO-dependent genes involved with skeletal muscle proteolysis have been associated with muscle atrophy and coined “atrogenes” (3, 14, 22, 26, 27).
Akt exists in three different isoforms that are encoded by separate genes: Akt1, Akt2, and Akt3 (16, 17, 31). Through the generation of isoform-specific Akt knockout mice, distinct functions of the different Akt isoforms have been proposed. Akt1 is expressed in all tissues and appears to regulate growth as Akt1 knockout mice have smaller body size without any other noticeable phenotype (9). Akt2 is expressed in skeletal muscle, adipose tissue, and liver and appears to control glucose homeostasis as Akt2 knockout mice have impaired glucose tolerance and reduced insulin-stimulated glucose transport (8). Akt3 is primarily expressed in the brain and testes, but Akt3 knockout mice have no noticeable phenotype other than reduced brain size (11, 28). Therefore, it appears that Akt1 controls growth and Akt2 controls glucose metabolism; however, more recent studies suggest an overlapping of Akt functions between the Akt1 and Akt2 isoforms (6, 10, 30). For example, Dummler et al. (6, 10, 30) demonstrated that mice that only express Akt1 (Akt2/3 double knockouts) are growth deficient, whereas other studies have shown that Akt1 null mice have enhanced insulin sensitivity (6, 10, 30).
Although Akt is known to regulate muscle mass by controlling FOXO-dependent atrogene expression, the Akt isoform that controls this process is not established. Therefore, the first goal of this study was to determine the effect of isoform-specific Akt gene ablation on atrogene expression. The effect of isoform-specific Akt ablation on Akt/FOXO signaling in muscles composed of distinctly different fiber types is unknown. In this regard, the second goal of our study was to determine the effect of isoform-specific Akt gene ablation on Akt/FOXO signaling in the soleus, a muscle that expresses predominantly type I oxidative fibers, and the extensor digitorum longus, a muscle that expresses predominantly type II glycolytic fibers. To accomplish these two goals, we studied wild-type (WT) and isoform-specific Akt knockout (Akt1−/− and Akt2−/−) mice at the age of 18 mo old. Eighteen-month-old WT and Akt knockout mice were utilized based on the hypothesis that aging would accentuate specific actions of the respective Akt isoforms. Our results indicate that Akt1 and Akt2 ablation does not alter atrogin-1 expression, but increases Bnip3 and gabarapl, two autophagy-related atrogenes (3, 14, 22, 26, 27). Furthermore, we discovered that Akt2 knockout mice do not express Akt1 protein in extensor digitorum longus (EDL) muscles, a factor that likely contributes to the insulin resistance observed in Akt2 null mice.
METHODS
Animals.
WT C57B6 male mice were purchased from the Jackson Laboratory (Bar Harbor, ME), and Akt1−/− and Akt2−/− mice (>10th generation C57B6 backcross) were a generous gift from Dr. Morris J. Birnbaum (University of Pennsylvania, Philadelphia, PA). Upon arrival to the animal facility at Skidmore College, all mice (∼3 mo old) were housed individually with cage enrichment nest-lets and fed ad libitum chow and water. WT, Akt1−/−, and Akt2−/− mice were housed in the facility until the age of 18 mo before experiments were conducted, unless stated otherwise. For dietary-induced insulin resistance experiments, C57B6 male mice (∼2 mo old) were fed a high-fat diet (HFD) or a normal chow diet (CON) for 4 mo. All animal care and surgery were conducted in accordance with the National Research Council's Guide for Care and Use of Laboratory Animals (Institute of Laboratory Animal Resources, Commission on Life Sciences, 1996). All experimental protocols were approved by Skidmore College's Institutional Animal Care and Use Committee.
In vivo insulin action.
To assess the effect of Akt ablation on in vivo insulin action, mice were subjected to an insulin-assisted glucose tolerance (IAGT) test following a 6-h fast. Mice were simultaneously injected with glucose (2 g/kg body wt) and insulin (18 U/kg body wt). Glucose was measured by a glucometer in blood collected via the tail vein at 0, 15, 30, 45, and 60 min following the glucose-insulin injection. We have previously shown that the IAGT test detects insulin resistance as well as an insulin tolerance test in mice fed a HFD but avoids the severe hypoglycemia that is typically observed during and after insulin tolerance testing (25).
Surgical procedures and in vitro muscle incubations.
For harvesting tissues, mice were anesthetized with a 1:1:1 mixture of promace, ketamine hydrochloride, and xylazine by an intraperitoneal injection (0.015 ml/10 g body wt). EDL and soleus muscles were isolated intact for in vitro incubation, and quadriceps and tibialis anterior muscles were rapidly dissected, frozen in liquid nitrogen, and stored at −80°C until analysis. Isolated EDL and soleus muscles were transferred to 25-ml Erlenmeyer flasks (1 muscle/flask) containing 2 ml of oxygenated Krebs Henseleit buffer (0.160 M NaCl, 0.0046 M KCl, 0.0012 M KH2PO4, 0.0025 M NaHCO3, 0.0025 M CaCl2, and 0.0012 M MgSO4), 5 mM glucose, 0.75 mU/ml insulin, and incubated for 30 min at 37°C with shaking. All flasks were pregassed with 95% O2-5% CO2 for 3 min immediately before the incubations. After the 30 min incubation, muscles were frozen in liquid N2 and stored at −80°C.
Preparation of muscle extracts.
The frozen EDL, soleus, and tibialis anterior muscles were homogenized on ice using a motor-driven tissue grinder (Teflon-glass) in RIPA Buffer (Sigma Chemical) (1 ml buffer: 0.1 g muscle weight) containing protease and phosphatase inhibitor cocktails (Halt Protease/Halt Phosphatase, Thermo Fisher). The homogenates were rotated at 4°C for 1 h and then centrifuged at 9,000 g for 30 min at 4°C. The protein concentrations of the supernatants were determined by the BCA method (Pierce). The remaining skeletal muscle extract was utilized for electrophoretic analysis and immunoblotting experiments.
Electrophoretic analyses and immunoblotting.
Skeletal muscle extracts and molecular weight standards (Bio-Rad, Hercules, CA and Magic Mark, Invitrogen) were subjected to SDS-PAGE. The proteins were then electrophoretically transferred to Immobilon membranes and immunoblotted with the phospho-specific Akt antibodies pThr308 Akt and pSer473 Akt that recognize Akt when phosphorylated on Thr308 and Ser473, respectively. The phosphorylation of Thr308 and Ser473 is necessary for Akt activity (1). The phosphorylation of FOXO3a was assessed by a phospho-specific antibody that recognizes FOXO3a only when phosphorylated on Thr32, a site phosphorylated by Akt (29). After the membranes were washed, the light generated by the alkaline phosphatase conjugated secondary antibody and CDP-Star reagent was detected using a digital imaging system (UVP, Upland, CA). Phospho-specific immunoblots were stripped and reprobed with the Akt1 and Akt2 antibodies. An atrogin-1 antibody was used to assess atrogin-1 protein levels. To account for gel loading differences, all immunoblots were stripped and reprobed with an α-tubulin antibody. Relative signal intensities of the Akt1, Akt2, pThr308 Akt, pSer473 Akt, pThr32 FOXO3a, atrogin-1, and α-tubulin bands were determined by using the Total Lab software (Nonlinear, Durham, NC). All data were normalized to α-tubulin and expressed as a percentage of WT controls. The phospho-specific Akt and FOXO3a antibodies and the α-tubulin antibody were from Cell Signaling Technology (Beverly, MA), the atrogin-1 antibody was from EMC Biosciences (Versailles, KY), and the Akt1 and Akt2 antibodies were a generous gift from Dr. Morris J. Birnbaum (University of Pennsylvania, Philadelphia, PA).
Skeletal muscle RNA extraction and real time quantitative PCR.
Frozen quadriceps muscles from mice were manually ground with a porcelain mortar and pestle chilled in liquid N2. Total RNA was extracted from powdered muscle using an RNA extraction kit from Qiagen (RNeasy Fibrous Tissue Kit) and quantified by measuring absorbance at 260 nm using a spectrophotometer (Beckman Coulter, Brea, CA). Frozen EDL muscles were homogenized in a glass tube by a motor-driven homogenizer, and total RNA was extracted from the resultant homogenate and quantified in an identical manner as quadriceps muscles. A 1-μg aliquot of total RNA was reverse transcribed using the RETROscript kit from Ambion (Austin, TX). The resultant cDNA (20 ng cDNA/sample in triplicate) was then subjected to quantitative polymerase chain reaction (qPCR) using standard target-specific TaqMan gene expression assays and a real time PCR system (StepOne Plus Real-Time PCR System, Applied Biosystems, Foster City, CA). Relative quantitation of amplified cDNA targets were determined by the ΔΔCT method using StepOne v2.1 software (Applied Biosystems). The following TaqMan gene expression assays were used: Akt1 (Assay ID: Mm01331626_m1), atrogin-1 (Assay ID: Mm01207878_m1), Bnip3 (Assay ID: Mm00833810_g1), LC3 (Assay ID: Mm00458724_m1), gabarapl (Assay ID: Mm00457880_m1), and striated activator of Rho signaling (STARS) (Assay ID: Mm00615375_m1).
Statistical analysis.
To detect statistical significance for all dependent variables, a one-way analysis of variance (ANOVA) was utilized. After a significant F ratio, Fisher's LSD post hoc test was used to locate statistical differences between groups. Data are expressed as means ± SE, and the level of statistical significance was set at P ≤ 0.05.
RESULTS
Physical characteristics of WT, Akt1−/−, and Akt2−/− mice.
The effect of isoform-specific Akt ablation on body weight, adiposity, and muscle mass has been previously described in young mice (8, 9, 15), but these variables have not been studied in older Akt knockout mice. As shown in Table 1, body weight is significantly greater in WT mice compared with Akt1−/− or Akt2−/− mice, and Akt1−/− mice weighed significantly less than aged-matched Akt2−/− mice. The differences in body weight among WT and Akt knockout mice can be partially explained by the reduction in muscle mass and adiposity. Table 1 demonstrates that EDL muscle mass is significantly lower in Akt1−/− and Akt2−/− mice compared with WT mice. Soleus muscle mass of Akt1−/− mice were significantly less than WT mice. However, the effects of Akt gene ablation on muscle mass appear to be due, in part, to a reduction in total body mass as the muscle mass-to-body weight ratio indexes were not significantly different across genotypes (Table 1). With regards to adiposity, WT mice had significantly greater epididymal adipose tissue mass-to-body weight ratio than the Akt1−/− and Akt2−/− mice, indicating that differences in body weight are related to adipose tissue mass.
Table 1.
Physical characteristics of wild-type and Akt knockout mice
| Wild-Type (n = 21) | Akt1−/− (n = 12) | Akt2−/− (n = 4) | 1 × 3 ANOVA P-Value | |
|---|---|---|---|---|
| Body weight, mg | 37.1 ± 1.5* | 25.1 ± 0.6† | 30.2 ± 1.5 | 0.0001 |
| Soleus muscle mass, mg | 18.2 ± 1.0 | 13.3 ± 1.0‡ | 16.3 ± 2.0 | 0.0223 |
| Soleus mass (mg)/body weight (g) index | 0.493 ± 0.041 | 0.538 ± 0.037 | 0.416 ± 0.143 | 0.416 |
| EDL muscle mass, mg | 16.7 ± 1.0* | 12.6 ± 1.0 | 13.0 ± 2.0 | 0.008 |
| EDL mass (mg)/body weight (g) Index | 0.491 ± 0.046 | 0.508 ± 0.030 | 0.430 ± 0.068 | 0.576 |
| Epididymal adipose tissue mass, g | 1.44 ± 0.14* | 0.762 ± 0.088 | 0.333 ± 0.166 | 0.0004 |
| Epididymal adipose tissue mass (g)/body weight index | 50.90 ± 6.54* | 25.99 ± 3.11 | 12.65 ± 7.51 | 0.005 |
EDL, extensor digitorum longus.
Significantly different from all groups by Fisher's least signifcant difference (LSD), P ≤ 0.05;
significantly different from AKT2−/− by Fisher's LSD, P ≤ 0.05;
Significantly different from wild-type mice by Fisher's LSD, P ≤ 0.05.
In vivo and in vitro insulin action.
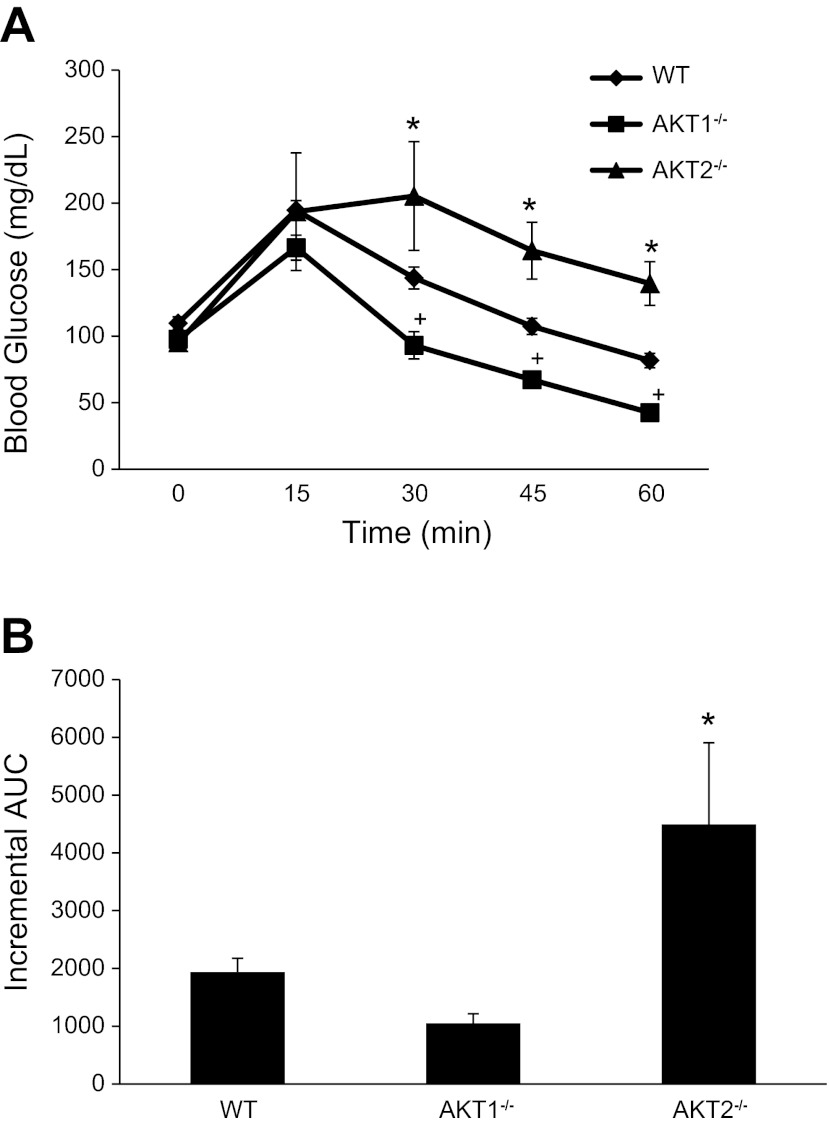
To assess the effects of isoform-specific Akt ablation on in vivo insulin action, we conducted IAGT tests. In the fasted basal state, blood glucose values were similar among the groups (WT: 109.8 ± 4.7 vs. Akt1−/−: 97.8 ± 4.0 vs. Akt2−/−: 95.0 ± 5.2). Blood glucose levels of Akt1−/− mice were significantly lower than WT and Akt2−/− mice at 30, 45, and 60 min following a simultaneous injection of glucose and insulin, indicating enhanced insulin action in Akt1 null mice (Fig. 1A). Blood glucose levels in Akt2−/− mice were significantly higher than age-matched WT mice, demonstrating profound insulin resistance (Fig. 1A). Figure 1B shows that the incremental area under the curve (AUC) is significantly lower in WT and Akt1−/− mice compared with Akt2−/−mice; however, there was only a trend for differences in incremental AUC between WT and Akt1−/− (P = 0.10). These findings indicate that the loss of Akt1 appears to promote insulin sensitivity, whereas the loss of Akt2 leads to severe insulin resistance.
Fig. 1.
Effect of Akt gene ablation on insulin-assisted glucose tolerance. Mice were fasted (6 h) and then given an intraperitoneal injection of insulin (18.0 U/kg body wt) and glucose (2 mg/g body wt) as described in the methods. Blood was collected from the tail vein at 0, 15, 30, 45, and 60 min following the insulin-glucose injection and assessed for glucose. The number of mice per group is 4–8. *Akt2−/− mice are significantly different from Akt1−/− and wild-type (WT) mice; +Akt1−/− mice are significantly different from WT mice.
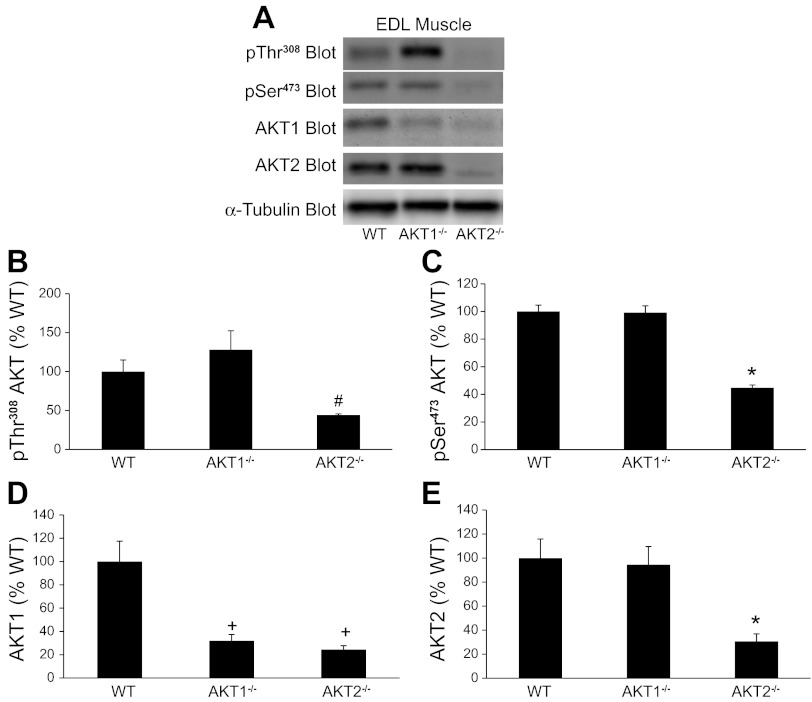
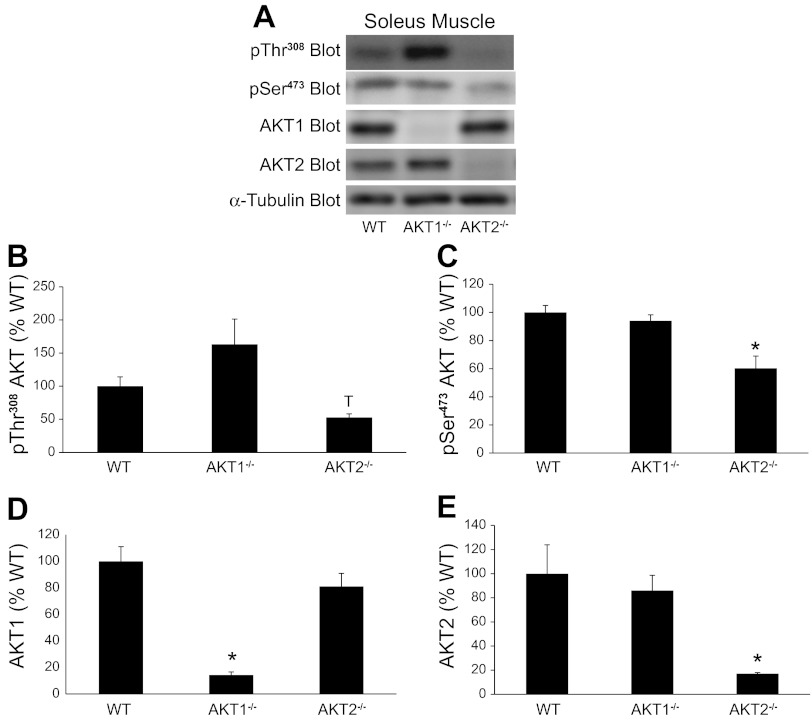
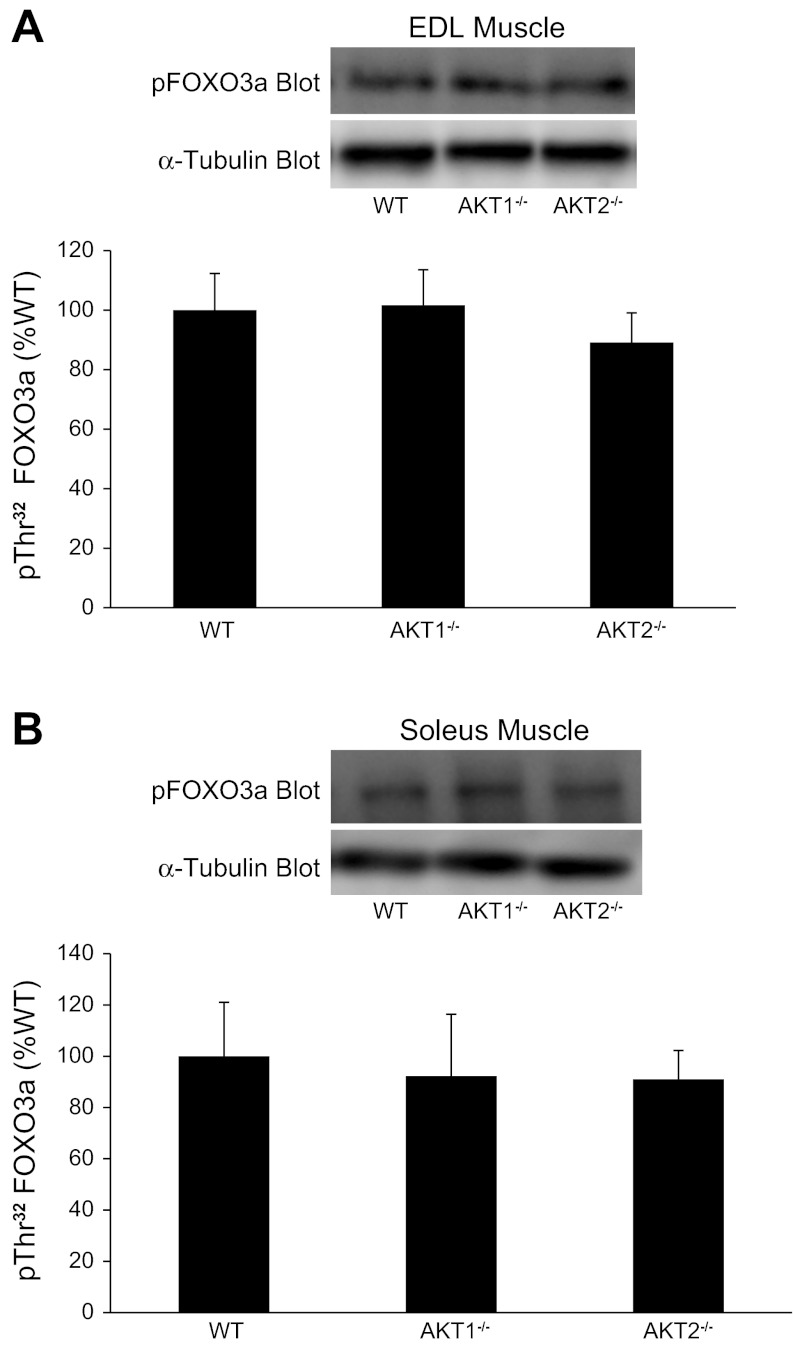
To assess in vitro insulin action, we incubated intact EDL and soleus muscle with insulin and measured Akt phosphorylation on Thr308 and Ser473 and FOXO3a phosphorylation on Thr32. Figures 2A and 3A show representative immunoblots containing EDL and soleus muscle extracts, respectively, that were prepared with a Thr308 or a pSer473 phospho-specific antibody. In EDL muscles from Akt2−/− mice, pThr308 and pSer473 immunoreactivity was significantly lower than in muscles from Akt1−/− mice (Fig. 2, B and C). In soleus muscles, pSer473 phosphorylation was significantly lower in Akt2−/− mice compared with Akt1−/− and WT mice (Fig. 3C). A 1 × 3 ANOVA only revealed a trend for a decrease in pThr308 phosphorylation in soleus muscle (P = 0.09), although a T-test showed significantly lower pThr308 immunoreactivity in soleus muscle from Akt2−/− compared with Akt1−/− mice (Fig. 3B). No significant differences in pThr308 or pSer473 immunoreactivity were observed in EDL or soleus muscles from Akt1−/− mice compared with WT mice. Despite the reduced ability for insulin to promote Thr308 and Ser473 phosphorylation in EDL and soleus muscles from Akt2−/− mice, FOXO3a phosphorylation on Thr32 was unchanged (Fig. 4), indicating that sufficient residual Akt activity maintained FOXO3a phosphorylation. It is important to note that we were technically unable to quantify total FOXO3a levels, therefore, we cannot rule out the possibility that changes in total amounts of FOXO3a may have influenced our Thr32 phosphorylation results.
Fig. 2.
Effect of Akt gene ablation on Akt phosphorylation and expression in extensor digitorum longus muscles (EDL). EDL muscles were isolated intact from WT and Akt null (Akt1−/−, Akt2−/−) mice and incubated in vitro as described in methods. Muscle extracts were prepared and Akt was assessed by immunoblotting with a pThr308 Akt, pSer473 Akt, Akt1, and Akt2 antibodies (A). The pThr308 Akt, pSer473 Akt, Akt1, and Akt2 immunoreactive bands were quantified, and data were normalized to total amounts of α-tubulin (B–E). The number of muscles per group is 4–8. *Significantly different from all other groups. +Significantly different from WT mice. #Significantly different from Akt1−/− mice.
Fig. 3.
Effect of Akt gene ablation on Akt phosphorylation and expression in soleus muscles. Soleus muscles were isolated intact from WT and Akt null (Akt1−/−, Akt2−/−) mice and incubated in vitro as described in methods. Muscle extracts were prepared and Akt was assessed by immunoblotting with a pThr308 Akt, pSer473 Akt, Akt1, and Akt2 antibodies (A). The pThr308 Akt, pSer473 Akt, Akt1, and Akt2 immunoreactive bands were quantified, and data were normalized to total amounts of α-tubulin (B–E). The number of muscles per group is 4–8. *Significantly different from all other groups. TSignificantly different from Akt1−/− mice by T-test but 1 × 3 ANOVA P value = 0.09.
Fig. 4.
Effect of Akt gene ablation on Forkhead box O (FOXO)3a phosphorylation on Thr32 in EDL and soleus muscles. EDL muscles (A) and soleus muscles (B) were isolated intact from WT and Akt null (Akt1−/−, Akt2−/−) mice and incubated in vitro as described in methods. Muscle extracts were prepared and FOXO3a phosphorylation on Thr32 was assessed by immunoblotting with a pThr32 FOXO3a antibody. The pThr32 FOXO3a immunoreactive bands were quantified, and data were normalized to total amounts of α-tubulin. The number of muscles per group is 4–8.
Effects of Akt ablation on Akt expression.
We also assessed the effects of Akt ablation on Akt1 and Akt2 expression in EDL and soleus muscles. Figure 2A shows representative immunoblots containing EDL muscle extracts that were prepared with an Akt1 or an Akt2 antibody. As expected, EDL muscles from Akt1−/− and Akt2−/− mice had significantly less Akt1 and Akt2 expression, respectively, compared with EDL muscles from WT mice (Fig. 2, D and E). Surprisingly, in EDL muscles of Akt2−/− mice we observed a significant reduction in Akt1 expression (Fig. 2D). Figure 3A shows representative immunoblots containing soleus muscle extracts that were prepared with an Akt1 or an Akt2 antibody. As expected, the soleus muscles from Akt1−/− and Akt2−/− mice had significantly less Akt1 and Akt2 expression, respectively, compared with soleus muscles from aged-matched WT mice (Fig. 3, D and E). Unlike EDL muscles of Akt2−/− mice, there was no change in Akt1 expression in soleus muscles from Akt2−/− mice (Fig. 3D).
We also conducted experiments to determine whether the loss of Akt1 expression in EDL muscles of Akt2−/− mice was regulated at the transcriptional level. Figure 5A shows that Akt1 mRNA levels are not reduced in quadriceps muscles of Akt2−/− mice compared with WT mice. Unlike the EDL muscle, the quadriceps muscle contains a mix of type I and type II fibers; therefore, we assessed Akt1 mRNA levels in EDL muscles of younger Akt2−/− mice and demonstrated no differences in Akt1 mRNA compared with age-matched WT mice (Fig. 5B). Because Akt1 mRNA of EDL muscles was assessed in young Akt2−/− mice (4 mo old), rather than 18 mo-old mice, we wanted to confirm that Akt1 protein was also reduced. As expected Akt1 protein levels were lower in EDL muscles of 4-mo-old Akt2−/− mice compared with age-matched WT mice (Fig. 5C). These observations provide evidence indicating that the loss of Akt1 expression in EDL muscles of Akt2−/− mice is not mediated by reductions in Akt1 gene transcription.
Fig. 5.
Effects of Akt gene ablation on Akt1 expression in quadriceps and EDL muscles. mRNA purified from quadriceps muscles of WT and Akt null (Akt1−/−, Akt2−/−) mice was reverse transcribed and subjected to qPCR as described in the methods (A). mRNA purified from EDL muscles of young WT (YG-WT) and YG-Akt2−/− mice was reverse transcribed and subjected to qPCR as described in methods (B). Muscle extracts were prepared from EDL muscles of YG-WT and YG-Akt2−/− mice, and Akt1 was assessed by immunoblotting with an Akt1 antibody (C). *Significantly different from muscle from all other groups.
Akt1 expression in diet-induced insulin resistance.
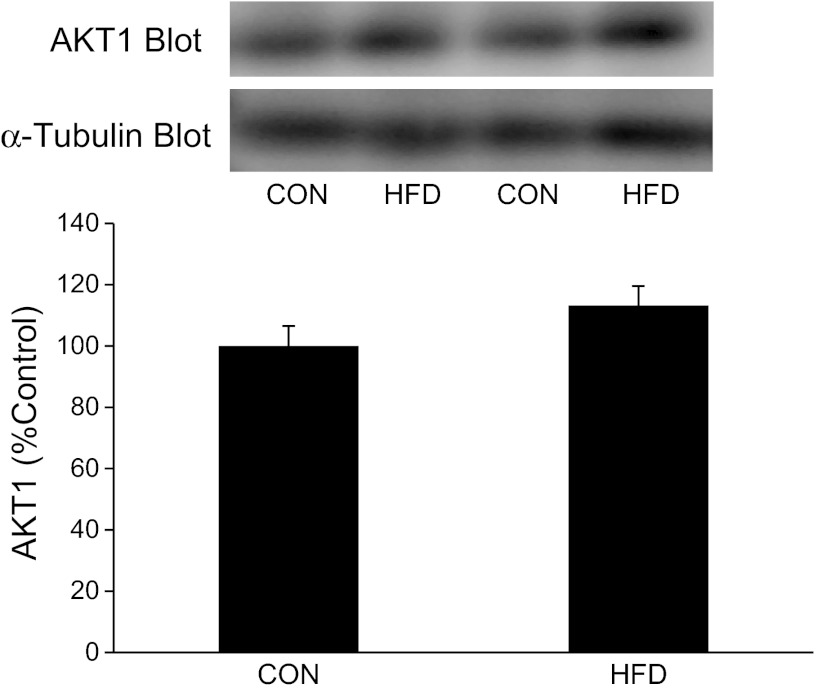
It is possible that the loss of Akt1 in EDL muscles of Akt2−/− mice was due, in part, to the severe insulin resistance observed in these mice. In this regard, we conducted Akt1 immunoblotting experiments in muscles from WT mice fed a HFD or CON diet for 4 mo. Figure 6 shows that diet-induced insulin resistance did not alter Akt1 immunoreactivity in tibialis anterior muscle. The tibialis anterior muscle contains a similar proportion of type I and II fibers as the EDL muscle and, therefore, serves as a good surrogate since we did not have EDL muscles from mice fed a HFD.
Fig. 6.
Effects of dietary-induced obesity/insulin resistance on Akt1 expression in skeletal muscles. Tibialis anterior muscles were isolated from control (CON) and high-fat diet fed mice (HFD) as described in methods. Muscle extracts were prepared, and Akt1 was assessed by immunoblotting with an Akt1 antibody. The Akt1 immunoreactive bands were quantified, and data were normalized to total amounts of α-tubulin. The number of muscles per group is 5–8.
Effects of Akt ablation on atrogene expression.
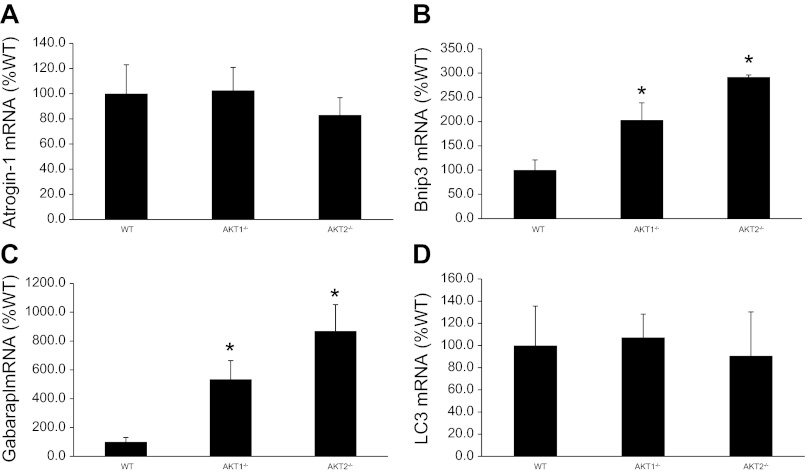
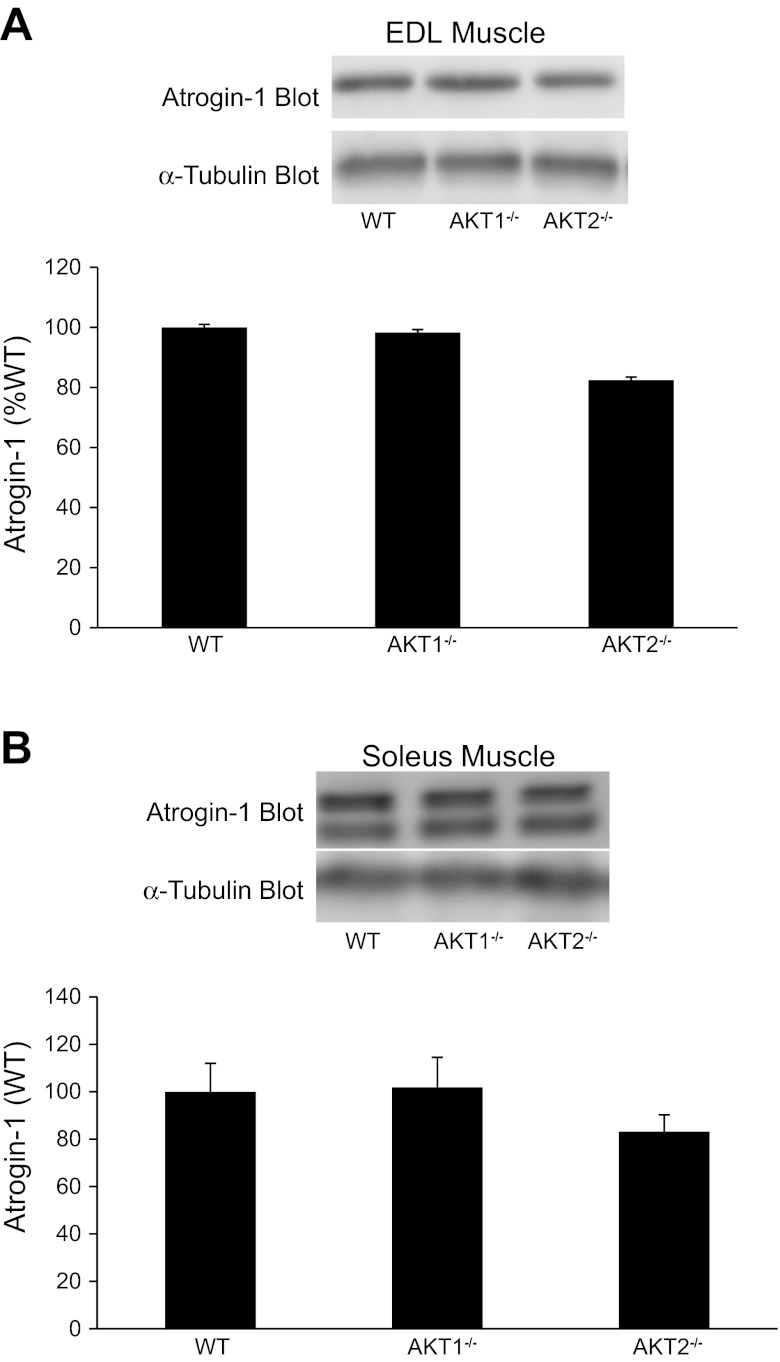
Because Akt plays an important role in the regulation of skeletal muscle size, we examined the expression of several muscle atrophy-related genes (atrogenes). Atrogin-1 is an E3 ubiquitin ligase in which its expression is suppressed by Akt activity and the subsequent nuclear exclusion of the transcription factor FOXO. We observed no significant changes in atrogin-1 mRNA or protein levels in quadriceps, soleus, and EDL muscles of Akt1−/− or Akt2−/− mice (Figs. 7A and 8). These results are surprising when considering the observation that Akt2−/− mice have a substantial decrease in Ser473 phosphorylation. However, as shown in Fig. 4, FOXO3a phosphorylation on Thr32 is identical in EDL and soleus muscles from Akt1−/−, Akt2−/−, and WT mice indicating that the subcellular location of FOXO3a was likely unchanged with Akt ablation; however, we cannot rule out the possibility that total FOXO3a levels might have influenced our Thr32 phosphorylation data. Although FOXO3a phosphorylation appears to be unchanged, we observed a significant increase in Bnip3 and gabarapl, two autophagic-related genes that are upregulated in multiple models of muscle atrophy (18, 22), in muscles from Akt1−/− and Akt2−/− mice. However, expression of LC3 did not change across genotypes (Fig. 7D).
Fig. 7.
Effects of Akt gene ablation on atrogene expression in quadriceps muscles. Total mRNA purified from quadriceps muscle of WT and Akt null (Akt1−/−, Akt2−/−) mice was reverse transcribed and subjected to qPCR as described in methods. *Muscles from Akt1−/− and Akt2−/− mice are significantly different from muscles of WT mice.
Fig. 8.
Effect of Akt gene ablation on atrogin-1 levels in EDL and soleus muscles. EDL muscles (A) and soleus muscles (B) were isolated intact from WT and Akt null (Akt1−/−, Akt2−/−) mice and incubated in vitro as described in methods. Muscle extracts were prepared and atrogin-1 expression was assessed by immunoblotting with an atrogin-1 antibody. The atrogin-1 immunoreactive bands were quantified, and data were normalized to total amounts of α-tubulin. The number of muscles per group is 4–8.
Effect of Akt ablation on STARS expression.
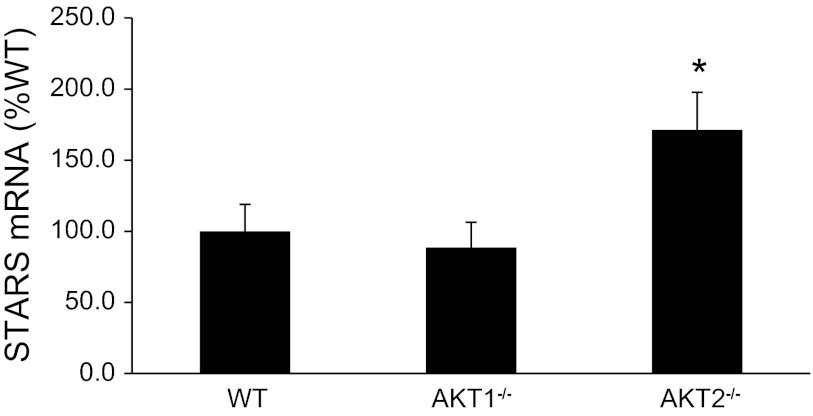
STARS is an actin binding protein that promotes actin polymerization and stimulates serum response factor (SRF) gene transcription. Increases in STARS expression is associated with pressure overload-induced hypertrophy in the mouse heart (20) and skeletal muscle hypertrophy in humans following resistance training (21). To determine a potential role for Akt in STARS regulation, we assessed STARS expression in muscles of our Akt knockout mice. Interestingly, STARS expression increased significantly in muscles from Akt2−/− mice, but not Akt1−/− mice (Fig. 9).
Fig. 9.
Effects of Akt gene ablation on striated activator of Rho signaling (STARS) expression in quadriceps muscles. Total mRNA purified from quadriceps muscle of WT and Akt null (Akt1−/−, Akt2−/−) mice was reverse transcribed and subjected to qPCR as described in methods. *Muscles from Akt2−/− mice are significantly different from muscles of WT and Akt1−/− mice.
DISCUSSION
The Akt signaling pathway regulates both insulin-stimulated glucose transport and skeletal muscle mass (4, 5, 31). Akt1 and Akt2 isoforms have been suggested to have distinct functions. Akt1 knockout mice have impaired growth and development but normal glucose metabolism, whereas Akt2 knockout mice experience normal growth and development but have decreases in whole body and skeletal muscle insulin sensitivity (8, 9). To accentuate potential isoform-specific effects of Akt1 and Akt2 on insulin action, Akt/FOXO signaling, and atrogene expression, the present investigation studied WT, Akt1−/−, and Akt2−/− mice at the age of 18 mo.
We demonstrate that Akt2−/− mice are severely insulin resistant. Similar to other investigations, the insulin resistance observed in Akt2 null mice is a unique phenotype that is not associated with obesity (7, 8, 13). Since muscle is the primary site for insulin-stimulated glucose disposal, it is reasonable to hypothesize that Akt2−/− mice have a defect in insulin signal transduction in this important metabolically active tissue. This idea is supported by a significant decline in insulin-stimulated glucose transport in EDL muscles from young Akt2 null mice; however, soleus muscles responded to insulin as well as WT mice (8). With this in mind, the present study examined Akt phosphorylation (pThr308 and pSer473) and isoform-specific Akt expression in EDL and soleus muscles from Akt2−/− mice and WT mice. In EDL muscles from Akt2−/− mice, we demonstrated a significant reduction in Akt1 expression that was so dramatic that levels were similar to the ablated Akt2 isoform (Fig. 2C). The loss of Akt1 expression in EDL muscles of Akt2 null mice appears to create a double knockout and likely accounts for the large decline in pSer473 phosphorylation in this tissue (Fig. 2B). However, in soleus muscles from Akt2−/− mice, Akt1 expression is similar to age-matched controls (Fig. 3C). Therefore, the loss of Akt1 in EDL muscle of Akt2−/− mice indicates that the deletion of Akt2 disrupts Akt1 expression in a muscle composed of predominantly type II glycolytic fibers but not in a muscle composed predominantly of type I oxidative fibers. Importantly, this observation may explain why Cho et al. (8) observed a decline in insulin-stimulated glucose transport in EDL muscles but not soleus muscles of Akt2−/− mice.
The present study demonstrates that the loss of Akt1 expression in EDL muscles of Akt2−/− mice is unlikely due to a defect in the transcription of the Akt1 gene. We have shown that Akt1 mRNA levels in quadriceps of Akt2−/− mice are actually slightly higher than age-matched WT mice (Fig. 5A). Because the quadriceps muscle contains a mixture of type I and type II muscle fibers, we repeated these experiments in EDL muscle of young Akt2−/− mice and demonstrated that Akt1 mRNA was not altered (Fig. 5B). Since young Akt2−/− mice (4 mo old) were utilized to assess Akt1 mRNA levels in EDL muscles, we wanted to confirm that Akt1 protein levels declined in a similar fashion as in older Akt2−/− mice (18 mo old). Therefore, we conducted immunoblotting experiments with EDL extracts prepared from young Akt2−/− mice and observed a significant decline in Akt1 protein levels (Fig. 5C), demonstrating that the levels of Akt1 protein in EDL muscles of Akt2 null mice are regulated at the posttranscriptional level. It is important to note that the magnitude of the decline in Akt1 protein levels in EDL muscles from young Akt2−/− mice was not as robust as in the older Akt2−/− mice, indicating that advancing age promotes the loss of Akt1 protein content when Akt2 is absent (compare Fig. 2C with Fig. 5C).
Because Akt2 gene ablation produces severe insulin resistance, it is possible that the decline in Akt1 protein expression in EDL muscles of Akt2−/− mice might be due to a decline in insulin action. Therefore, we examined Akt1 protein levels in tibialis anterior muscles of mice fed a HFD for 4 mo. Akt1 protein levels were identical in tibialis anterior muscles from mice fed a HFD compared with a normal chow diet (Fig. 6), indicating that insulin resistance does not explain the loss of Akt1 protein expression in EDL muscles of Akt2−/− mice. Indeed, this interpretation is not without limitations as our diet-induced insulin resistance study utilized the tibialis anterior muscle rather than the EDL muscle. This limitation is marginalized due to the tibialis anterior and the EDL muscle having almost an identical proportion of type I and II fibers. Another possible limitation is that the insulin resistance of Akt2−/− mice may be distinct from diet-induced insulin resistance as only the latter is associated with obesity.
A particularly interesting and novel finding of the present study is the increase in STARS expression in muscles of Akt2−/− mice. STARS is a muscle-specific actin binding protein that activates Rho signaling and stimulates actin polymerization and SRF-dependent gene transcription (2). Recently, STARS expression was associated with insulin resistance, while reducing STARS levels increased Akt signaling and glucose uptake (19). One possibility is that increased STARS expression may have played a role in the decline in Akt phosphorylation and or expression that we observed in muscles of Akt2−/− mice. Alternatively, the severe insulin resistance of the Akt2−/− mice, rather than the whole body ablation of Akt2, may have been responsible for the increase in STARS expression. Further research is needed to uncover how STARS/SRF-dependent gene expression regulates Akt expression and/or phosphorylation as well as insulin action.
The present study demonstrates that aged Akt1−/− mice have significantly lower blood glucose values during an insulin-assisted glucose tolerance test than WT mice. Other investigators have implicated Akt1 in the regulation of glucose metabolism (6, 9, 30). The Cho et al. group's (9) original description of young Akt1 null mice revealed a trend for improved glucose tolerance, but this did not reach the threshold for statistical significance. By studying mice at the age of 18 mo old, we may have accentuated the deleterious effect Akt1 has on glucose metabolism. The mechanism responsible for the higher insulin sensitivity in Akt1−/− is difficult to explain as it would be expected that less total Akt would promote insulin resistance rather than insulin sensitivity. However, unlike Akt2−/−, muscles from Akt1−/− mice do not have lower levels of pSer473 phosphorylation. It appears that the improved insulin action in Akt1−/− mice is related to their resistance to diet-induced obesity and increased metabolic rate (30). In fact, we show that Akt1−/− mice have a 50% reduction in epididymal white adipose tissue mass, a factor that likely explains a good portion of the increased insulin sensitivity. Further research is needed to identify the mechanism responsible for the enhanced metabolism and obesity resistance of Akt1−/− mice.
Akt signaling promotes muscle hypertrophy, in part, by suppressing the expression of atrogenes (3, 14, 26, 27), a process that involves the transcription factor FOXO. Activation of Akt results in the phosphorylation and nuclear exclusion of FOXO denying the transcription factor's access to its DNA targets and greatly reducing FOXO-dependent gene transcription. One Akt/FOXO-dependent gene is a muscle-specific F-box protein designated MAFbx (muscle atrophy F-box) or atrogin-1, a ubiquitin ligase whose expression is associated with increased protein degradation and muscle atrophy (4, 14). The present study demonstrates that atrogin-1 expression is unchanged in quadriceps muscles as well as soleus and EDL muscles of Akt1−/− or Akt2−/− mice (Figs. 7A and 8). Although the phosphorylation of Akt is significantly reduced in our Akt2−/− mice, the phosphorylation of FOXO3a on Thr32, the residue phosphorylated by Akt, is unaltered (Fig. 4). This finding suggests that either the remaining residual Akt activity is sufficient for proper FOXO3a control or that there is a compensatory adaptation that either altered total FOXO3a expression or allowed another kinase to phosphorylate FOXO3a. Unlike the negligible effect of Akt gene ablation on FOXO3a phosphorylation and atrogin-1 expression, the expression of Bnip3 and gabarapl, two autophagic-related atrogenes (23, 32), is significantly increased in quadriceps muscles of Akt1−/− and Akt2−/− mice (Fig. 7, B and C). This observation is surprising, at least for Bnip3, as it has been shown to control autophagy in skeletal muscle in a FOXO3-dependent manner (23, 32). Unlike the increase in Bnip3 and gabarapl, LC3 expression is not altered in muscles from Akt1 and Akt2 knockout mice, a finding that is consistent with observation that FOXO3a phosphorylation is unaltered. Taken together, our data suggest that Akt controls Bnip3 and gabarapl expression independent of FOXO3a but LC3 expression is regulated by FOXO3a independent of Akt. However, additional studies that directly assess autophagy in muscles that have loss and gain of Akt and FOXO3a function are needed.
Recent evidence demonstrates that FOXO3 regulates skeletal muscle mass by controlling Bnip3 and LC3 expression and autophagy (23, 32). In the present study, we demonstrate that EDL muscle mass is significantly lower in both Akt1 and Akt2 knockouts, but soleus muscle mass is significantly lower only in Akt1 knockouts. The more robust effect of Akt2 ablation on EDL muscle mass compared with soleus muscle mass observed in the present study may be related to the EDL muscle being more susceptible to autophagy than the soleus muscle (24). However, this interpretation is limited by two reasons: 1) we assessed autophagic gene expression in quadriceps muscles rather than EDL and soleus muscle so any relationship with muscle mass must be viewed cautiously; and 2) although EDL and soleus muscle mass is reduced in Akt knockout mice, the muscle mass-body weight index for EDL and soleus muscles is unchanged indicating a general reduction in total body mass rather than muscle atrophy. Perhaps Akt ablation resulted in a compensatory adaptation that preserves muscle mass even though Bnip3 and gabarapl are elevated.
Perspectives and Significance
The results of the present study demonstrate both divergent and redundant roles for Akt isoforms in regulating whole body insulin action and FOXO-dependent atrogene expression. Our data show that Akt1 knockout mice maintain whole body insulin action and Akt2 knockout mice develop severe insulin resistance. The effects of isoform-specific Akt ablation on whole body insulin action is mirrored in the ability of insulin to promote Akt phosphorylation on Thr308 and Ser473, two sites whose phosphorylation is necessary for Akt kinase activity (1). Interestingly, the ablation of Akt2 resulted in the loss of Akt1 expression in EDL muscles, but not soleus muscles, indicating a fiber-type-specific effect that likely contributed to the reduced whole body insulin action observed in Akt2 null mice. Furthermore, STARS expression was higher in muscles from Akt2−/− mice, but not Akt1−/− mice, a process that may not be due to Akt2 ablation per se, but rather due to the insulin resistance resulting from Akt2 knockout. Despite the differences in whole body insulin action and Akt phosphorylation, both Akt1−/− and Akt2−/− mice exhibited similar levels of FOXO3a phosphorylation and atrogin-1 expression compared with age-matched WT mice. However, expression of the autophagic atrogenes, Bnip3 and gabarapl, were increased in muscles from both Akt1 and Akt2 null mice, indicating FOXO3a independent redundancy in Akt1 and Akt2 signaling. Taken together, these results suggest a disassociation of insulin action and Akt/FOXO3a signaling to atrogenes.
GRANTS
This work was supported by the National Institutes of Health (1R15AG031504-01), the Skidmore College Summer Research Program, and an American Physiological Society Summer Research Fellowship to E. Merrell.
DISCLOSURES
No conflicts of interest, financial or otherwise, are declared by the author(s).
AUTHOR CONTRIBUTIONS
Author contributions: T.H.R. conception and design of research; T.H.R., E.M., N.C., M.G., and L.N. performed experiments; T.H.R., E.M., N.C., and M.G. analyzed data; T.H.R. interpreted results of experiments; T.H.R. prepared figures; T.H.R. drafted manuscript; T.H.R. edited and revised manuscript; T.H.R. approved final version of manuscript.
ACKNOWLEDGMENTS
The authors are grateful to Dr. Morris Birnbaum of the University of Pennsylvania for donating the Akt knockout mice and to Dr. Thurl E. Harris of the University of Virginia and the Sponsored Research Office at Skidmore College for assistance with manuscript preparation.
REFERENCES
- 1. Alessi DR, Andjelkovic M, Caudwell B, Cron P, Morrice N, Cohen P, Hemmings BA. Mechanism of activation of protein kinase B by insulin and IGF-1. EMBO J 23: 6541–6551, 1996 [PMC free article] [PubMed] [Google Scholar]
- 2. Arai A, Spencer JA, Olson EN. STARS, a striated muscle activator of Rho signaling and serum response factor-dependent transcription. J Biol Chem 27: 24453–24459, 2002 [DOI] [PubMed] [Google Scholar]
- 3. Bodine SC. mTOR signaling and the molecular adaptation to resistance exercise. Med Sci Sports Exerc 38: 1950–1957, 2006 [DOI] [PubMed] [Google Scholar]
- 4. Bodine SC, Latres E, Baumhueter S, Lai VK, Nunez L, Clarke BA, Poueymirou WT, Panaro FJ, Na E, Dharmarajan K, Pan ZQ, Valenzuela DM, DeChiara TM, Stitt TN, Yancopoulos GD, Glass DJ. Identification of ubiquitin ligases required for skeletal muscle atrophy. Science 294: 1704–1708, 2001 [DOI] [PubMed] [Google Scholar]
- 5. Bodine SC, Stitt TN, Gonzalez M, Kline WO, Stover GL, Bauerlein R, Zlotchenko E, Scrimgeour A, Lawrence JC, Glass DJ, Yancopoulos GD. Akt/mTOR pathway is a crucial regulator of skeletal muscle hypertrophy and can prevent muscle atrophy in vivo. Nat Cell Biol 11: 1014–1019, 2001 [DOI] [PubMed] [Google Scholar]
- 6. Buzzi F, Xu L, Zuellig RA, Boller SB, Spinas GA, Hynx D, Chang Z, Yang Z, Hemmings BA, Tschopp O, Niessen M. Differential effects of protein kinase B/Akt isoforms on glucose homeostasis and islet mass. Mol Cell Biol 3: 601–612, 2010 [DOI] [PMC free article] [PubMed] [Google Scholar]
- 7. Chen WS, Peng XD, Wang Y, Xu PZ, Chen ML, Luo Y, Jeon SM, Coleman K, Haschek WM, Bass J, Philipson LH, Hay N. Leptin deficiency and beta-cell dysfunction underlie type 2 diabetes in compound Akt knockout mice. Mol Cell Biol 11: 3151–3162, 2009 [DOI] [PMC free article] [PubMed] [Google Scholar]
- 8. Cho H, Mu J, Kim JK, Thorvaldsen JL, Chu Q, Crenshaw EB, 3rd, Kaestner KH, Bartolomei MS, Shulman GI, Birnbaum MJ. Insulin resistance and a diabetes mellitus-like syndrome in mice lacking the protein kinase Akt2 (PKB beta). Science 292: 1728–1731, 2001 [DOI] [PubMed] [Google Scholar]
- 9. Cho H, Thorvaldsen JL, Chu Q, Feng F, Birnbaum MJ. Akt1/PKBalpha is required for normal growth but dispensable for maintenance of glucose homeostasis in mice. J Biol Chem 276: 38349–38352, 2001 [DOI] [PubMed] [Google Scholar]
- 10. Dummler B, Tschopp O, Hynx D, Yang ZZ, Dirnhofer S, Hemmings BA. Life with a single isoform of Akt: mice lacking Akt2 and Akt3 are viable but display impaired glucose homeostasis and growth deficiencies. Mol Cell Biol 26: 8042–8051, 2006 [DOI] [PMC free article] [PubMed] [Google Scholar]
- 11. Easton RM, Cho H, Roovers K, Shineman DW, Mizrahi M, Forman MS, Lee VM, Szabolcs M, de Jong R, Oltersdorf T, Ludwig T, Efstratiadis A, Birnbaum MJ. Role for Akt3/protein kinase Bgamma in attainment of normal brain size. Mol Cell Biol 25: 1869–1878, 2005 [DOI] [PMC free article] [PubMed] [Google Scholar]
- 12. Faridi J, Fawcett J, Wang L, Roth RA. Akt promotes increased mammalian cell size by stimulating protein synthesis and inhibiting protein degradation. Am J Physiol Endocrinol Metab 285: E964–E972, 2003 [DOI] [PubMed] [Google Scholar]
- 13. Garofalo RS, Orena SJ, Rafidi K, Torchia AJ, Stock JL, Hildebrandt AL, Coskran T, Black SC, Brees DJ, Wicks JR, McNeish JD, Coleman KG. Severe diabetes, age-dependent loss of adipose tissue, and mild growth deficiency in mice lacking Akt2/PKB beta. J Clin Invest 112: 197–208, 2003 [DOI] [PMC free article] [PubMed] [Google Scholar]
- 14. Gomes MD, Lecker SH, Jagoe RT, Navon A, Goldberg AL. Atrogin-1, a muscle-specific F-box protein highly expressed during muscle atrophy. Proc Natl Acad Sci USA 98: 14440–14445, 2001 [DOI] [PMC free article] [PubMed] [Google Scholar]
- 15. Goncalves MD, Pistilli EE, Balduzzi A, Birnbaum MJ, Lachey J, Khurana TS, Ahima RS. Akt deficiency attenuates muscle size and function but not the response to ActRIIB inhibition. PLos One 9: e12707–e12707, 2010 [DOI] [PMC free article] [PubMed] [Google Scholar]
- 16. Gonzalez E, McGraw TE. The Akt kinases: isoform specificity in metabolism and cancer. Cell Cycle 8: 2502–2508, 2009 [DOI] [PMC free article] [PubMed] [Google Scholar]
- 17. Hers I, Vincent EE, Tavare JM. Akt signalling in health and disease. Cell Signal 23: 1515–1527, 2011 [DOI] [PubMed] [Google Scholar]
- 18. Jagoe RT, Lecker SH, Gomes M, Goldberg AL. Patterns of gene expression in atrophying skeletal muscles: response to food deprivation. FASEB J 16: 1697–1712, 2002 [DOI] [PubMed] [Google Scholar]
- 19. Jin W, Goldfine AB, Boes T, Henry RR, Ciaraldi TP, Kim E, Emecan M, Fitzpatrick C, Sen A, Shah A, Mun E, Vokes V, Schroeder J, Tatro E, Jimenez-Chillaron J, Patti M. Increased SRF transcriptional activity in human and mouse skeletal muscle is a signature of insulin resistance. J Clin Invest 121: 918–929, 2011 [DOI] [PMC free article] [PubMed] [Google Scholar]
- 20. Kuwahara K, Teg Pipes GC, McAnally J, Richardson JA, Hill JA, Bassel-Duby R, Olson EN. Modulation of adverse cardiac remodeling by STARS, a mediator of MEF2 signaling and SRF activity. J Clin Invest 117: 1324–1334, 2007 [DOI] [PMC free article] [PubMed] [Google Scholar]
- 21. Lamon S, Wallace MA, Léger B, Russell AP. Regulation of STARS and its downstream targets suggest a novel pathway involved in human skeletal muscle hypertrophy and atrophy. J Physiol 587: 1795–1803, 2009 [DOI] [PMC free article] [PubMed] [Google Scholar]
- 22. Lecker SH, Jagoe RT, Gilbert A, Gomes M, Baracos V, Bailey J, Price SR, Mitch WE, Goldberg AL. Multiple types of skeletal muscle atrophy involve a common program of changes in gene expression. FASEB J 18: 39–51, 2004 [DOI] [PubMed] [Google Scholar]
- 23. Mammucari C, Milan G, Romanello V, Masiero E, Rudolf R, Del Piccolo P, Burden SJ, Di Lisi R, Sandri C, Zhao J, Goldberg AL, Schiaffino S, Sandri M. FoxO3 controls autophagy in skeletal muscle in vivo. Cell Metab 6: 458–471, 2007 [DOI] [PubMed] [Google Scholar]
- 24. Mizushima N, Yamamoto A, Matsui M, Yoshimori T, Ohsumi Y. In vivo analysis of autophagy in response to nutrient starvation using transgenic mice expressing a fluorescent autophagosome marker. Mol Biol Cell 15: 1101–1111, 2004 [DOI] [PMC free article] [PubMed] [Google Scholar]
- 25. Reynolds TH, 4th Cinquino N, Anthony M, Phelps CB, Zachary Berk E. Insulin resistance without elevated mammalian target of rapamycin complex 1 activity in muscles of mice fed a high-fat diet. J Appl Physiol 107: 1479–1485, 2009 [DOI] [PMC free article] [PubMed] [Google Scholar]
- 26. Sacheck JM, Ohtsuka A, McLary SC, Goldberg AL. IGF-I stimulates muscle growth by suppressing protein breakdown and expression of atrophy-related ubiquitin ligases, atrogin-1 and MuRF1. Am J Physiol Endocrinol Metab 287: E591–E601, 2004 [DOI] [PubMed] [Google Scholar]
- 27. Sandri M, Sandri C, Gilbert A, Skurk C, Calabria E, Picard A, Walsh K, Schiaffino S, Lecker SH, Goldberg AL. Foxo transcription factors induce the atrophy-related ubiquitin ligase atrogin-1 and cause skeletal muscle atrophy. Cell 117: 399–412, 2004 [DOI] [PMC free article] [PubMed] [Google Scholar]
- 28. Tschopp O, Yang ZZ, Brodbeck D, Dummler BA, Hemmings-Mieszczak M, Watanabe T, Michaelis T, Frahm J, Hemmings BA. Essential role of protein kinase B gamma (PKB gamma/Akt3) in postnatal brain development but not in glucose homeostasis. Development 132: 2943–2954, 2005 [DOI] [PubMed] [Google Scholar]
- 29. Van Der Heide LP, Hoekman MF, Smidt MP. The ins and outs of FoxO shuttling: mechanisms of FoxO translocation and transcriptional regulation. Biochem J 380: 297–309, 2004 [DOI] [PMC free article] [PubMed] [Google Scholar]
- 30. Wan M, Easton RM, Gleason CE, Monks BR, Ueki K, Kahn CR, Birnbaum MJ. Loss of Akt1 in mice increases energy expenditure and protects against diet-induced obesity. Mol Cell Biol 32: 96–106, 2012 [DOI] [PMC free article] [PubMed] [Google Scholar]
- 31. Whiteman EL, Cho H, Birnbaum MJ. Role of Akt/protein kinase B in metabolism. Trends Endocrinol Metab 13: 444–451, 2002 [DOI] [PubMed] [Google Scholar]
- 32. Zhao J, Brault JJ, Schild A, Cao P, Sandri M, Schiaffino S, Lecker SH, Goldberg AL. FoxO3 coordinately activates protein degradation by the autophagic/lysosomal and proteasomal pathways in atrophying muscle cells. Cell Metab 6: 472–483, 2007 [DOI] [PubMed] [Google Scholar]


