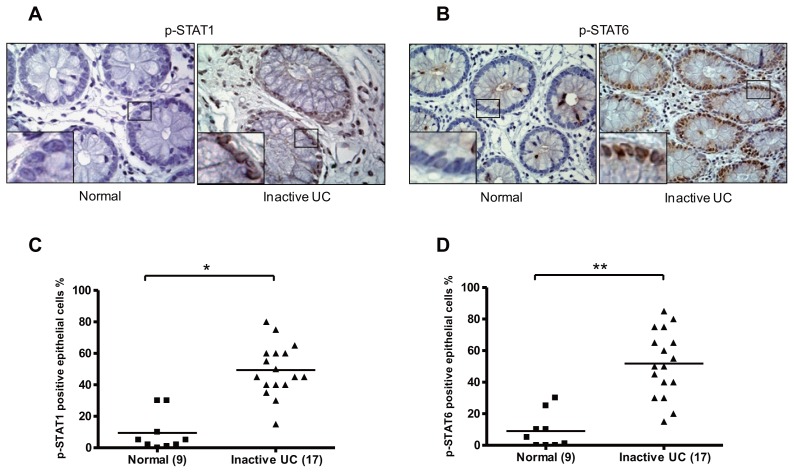
Figure 4.
IHC staining of p-STAT1 (A) and p-STAT6 (B) IEC-positive cells between patients with inactive UC and controls (nuclear staining). Quantification of the percentage positive IEC in each biopsy showed a significantly increased percentages of p-STAT1–positive (*p < 0.0001) (C) and p-STAT6–positive (**p = 0.0001) (D) IEC in biopsies from patients with inactive UC compared with control biopsies.

