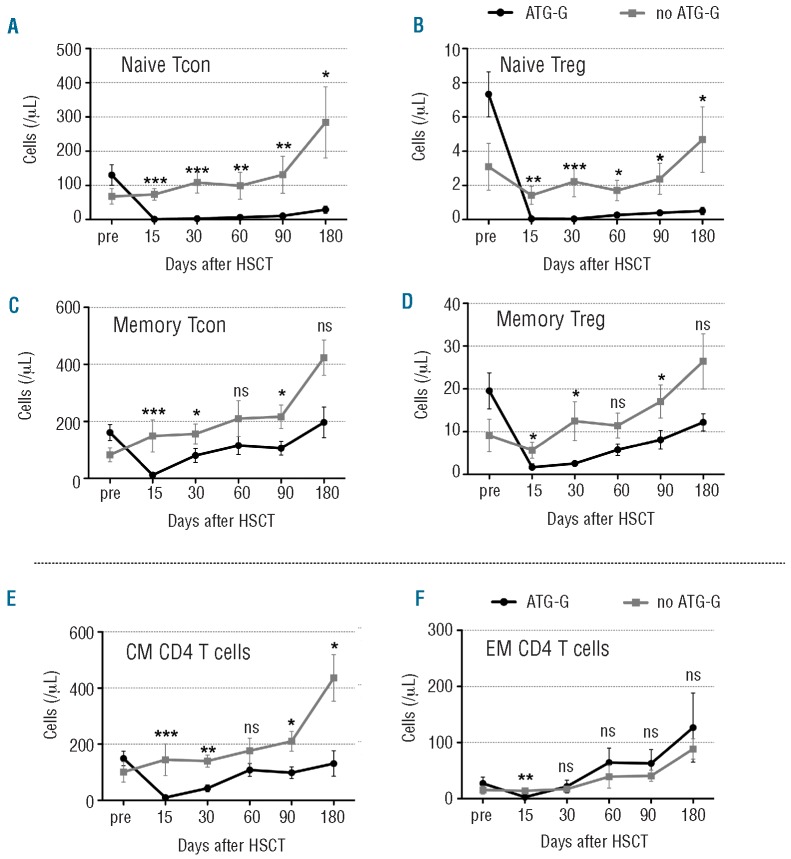
Figure 2.
Reconstitution of the CD4 T-cell naïve and memory compartments. The graphs illustrate (A) naïve conventional CD4 T cells (naïve Tcon; CD25lowFOXP3-CD45RA+), (B) naïve regulatory CD4 T cells (naïve Treg; CD25highFOXP3+CD45RA+), (C) memory Tcon (CD25lowFOXP3-CD45RO+CD45RA-) and (D) memory Treg(CD25highFOXP3+CD45RO+CD 45RA-). Graphs (E) and (F) illustrate central memory (CM, CD45RO+CD62L+CCR7+) and effector memory (EM, CD45RO+CD62L-CCR7-) subsets of total CD4 T cells, respectively. Data were collected before (pre) and after transplantation. Mean values of absolute numbers of cells/μL ± standard error of mean (SEM) are given. Differences in cell counts between patients treated or not with ATG-G were statistically evaluated using the Mann-Whitney test. *P<0.05; **P<0.01; ***P<0.005.

