Figure 5.
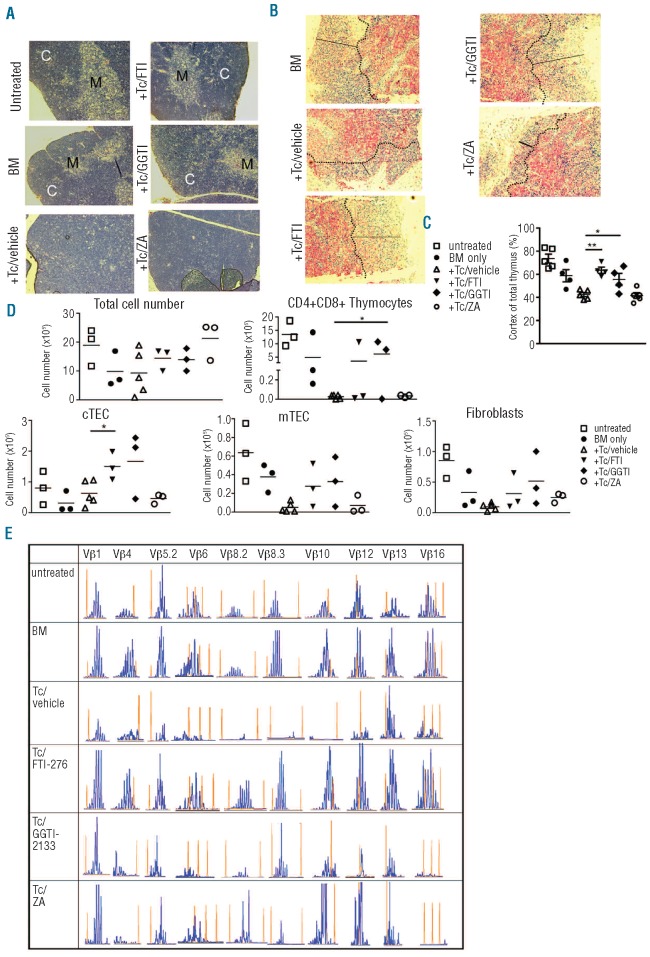
FTI and GGTI reduce thymic damage and favor a polyclonal TCR repertoire. (A) Thymi were removed on day 10 from three mice in each group (vehicle; ZA)/d100 (others) and paraffin-fixed thymus sections (untreated, BM only, +T cells (Tc)/vehicle, +Tc/FTI, +Tc/GGTI and Tc/ZA) were analyzed for detection of the corticomedullary junction. C, cortex; M, medulla. Original magnification ×100. Representative sections are shown. (B) Representative paraffin-fixed thymus sections collected as described above (a) from the indicated groups were stained for K5-positive (red) medullary regions and analyzed by conventional microscopy. The dotted lines indicate the corticomedullary junction and solid lines represent cortical thickness. Original magnification, ×100. Representative images are shown. (C) The cortical area (% of total area) was quantified by using the CK5 negative region. Symbols represent individual animals, the horizontal bars indicate the mean. P-values: untreated versus vehicle P=0.039; BM only versus vehicle P=0.41. (D) Thymic cell subsets were assessed by flow cytometry on day 12 from three mice in each group. Absolute numbers are displayed. mTec: CD45-MHC class IIint/hiUEA-1+; Fibroblasts: CD45-PDGFR1 (CD140b)+(*P<0.05). (E) TCR Vβ usage of splenic T cells on day 20 after transplantation in BALB/c recipients is shown for the respective groups (untreated, BM only, +Tc/vehicle, +Tc/FTI, +Tc/GGTI and Tc/ZA). Spectratyping analysis of CDR3 length distribution was performed using C57BL/6-specific Vβ and common Cβ primers from purified splenic T cells. Representative spectratypes of Vβ1, 4, 5.2, 6, 8.2, 8.3, 10, 12, 13 and 16 gene families are shown. Histograms (blue peaks) depict CDR3 sequence lengths (x-axis) and frequency of occurrence (y axis). Red peaks within each histogram represent molecular weight markers added to the run-off reactions. Data are representative of at least three animals studied per group, from one of two experiments.

