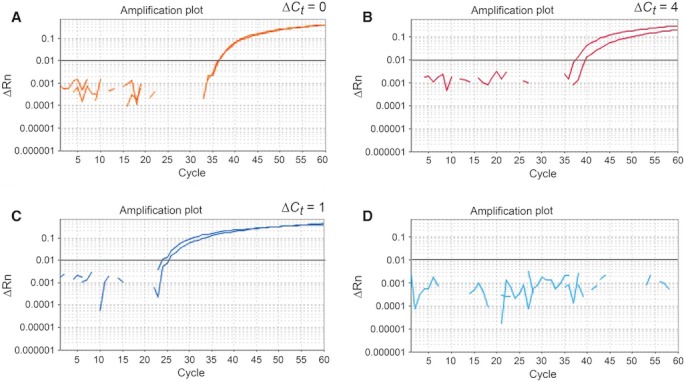
Fig. 2.

Amplification plots from the HER2 DNA copy-number real-time PCR assay. Representative plots depicting (A) non-amplification of HER2, (B) amplification of HER2, (C) DNA control, purified from blood, (D) H2O control, a blind sample to ensure the assay does not contain DNA contaminants.
