
Figure 2.
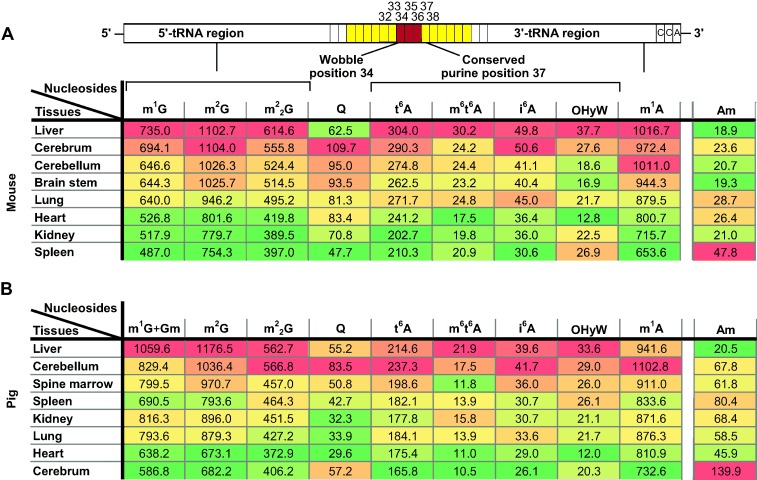
Quantitative data for the investigated tRNA modifications in various murine (A) and porcine (B) tissues. All tRNA nucleoside values are given per 1000 tRNA molecules (‰). These data reveal a similar, tissue-dependent extent of modification for all investigated modified nucleosides except Am. Color codes in (A) and (B) are based on quantile calculations; red: highest value, yellow: 50 % quantile, green: lowest value. For intermediate values appropriate intermediate shades were calculated. Despite the slight variation in the absolute quantification values, trends in modification content were conserved across different biological samples (both in mouse and pig, see Tables S2–S5 in the Supporting Information).