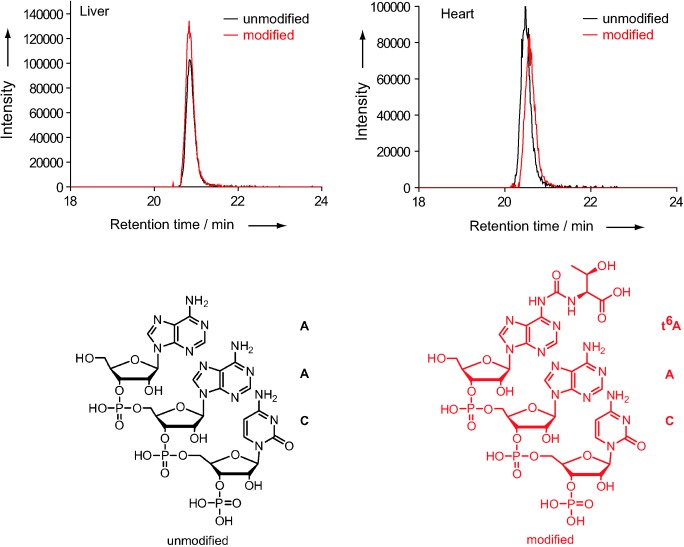
Figure 3.

Representative qualitative comparison of amounts of unmodified RNA fragments AAC and the corresponding modified t6AAC in the RNase A digests of liver and heart tRNA. Overlayed LC–MS chromatograms showing ions detected at the calculated masses of the AAC (m/z=489.5682–489.5742) and t6AAC (m/z=562.0863–562.0933) fragments (z=−2) and the corresponding structures. The ratio of the peak areas of modified to unmodified fragments for liver can be seen to be higher than that for heart. Further identified fragment ratios are listed in Table S9 in the Supporting Information.
