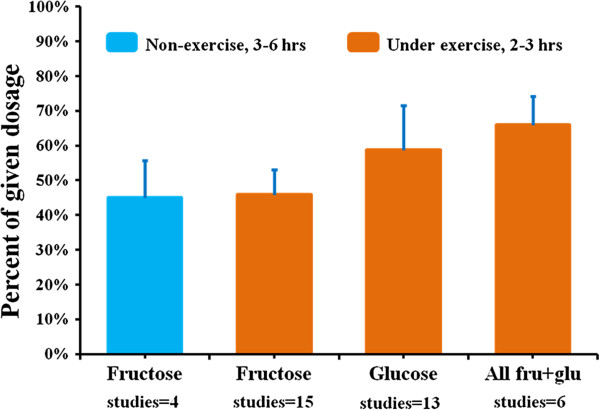
Figure 2.
Dietary fructose and glucose oxidation (in normal subjects, mean + SD). On horizontal axis, ‘studies = number’ means that how many studies the bar data averaged from. In the Figure, 3–6 hours and 2–3 hours represent study monitoring period. The noted data variations between studies could be due to the differences of sugar dosages, tracer labeling forms, sugar administration methods, subject characteristics, and/or measurement errors. Also, the produced CO2 from labeled sugar oxidation can arise directly from sugar molecules themselves, or other compounds converted from the sugars, such as glucose, lactate, or fatty acid from fructose.

