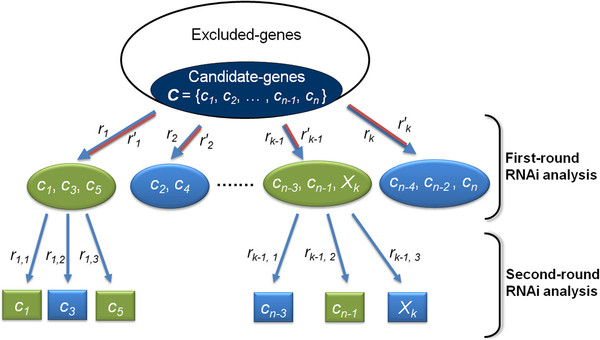
Figure 3.
Schematic diagram of the hierarchical RNAi analysis for identifying genes that are involved in a specific phenotype. R = {r1, r2, …, rk} is the set of qualified siRNAs that were selected by our modified algorithm. The candidate-genes in each ellipse are the target genes of each available siRNA ri. In the first-round RNAi analysis, we can quickly determine which candidate-genes could be related to the target phenotype based on the RNAi experiment results. The green ellipse represents the target phenotype that was affected in the RNAi experiment with ri, whereas the blue ellipse indicates that the target phenotype was not affected. In the second-round RNAi analysis, we further examined the candidate-genes in the green ellipses to precisely identify the related genes. However, the complementary strand of the selected siRNA, r′i, can also be loaded into the RISC, and it could facilitate RNAi. A gene that contains a subsequence that contains no more than dT mismatches to r′i would be regarded as the possible target gene of r′i, which is defined as Xi. To precisely identify the associated gene from the genes that are affected by ri and r′i, we would silence those genes one-on-one to identify which genes were definitively associated with the target phenotype.

