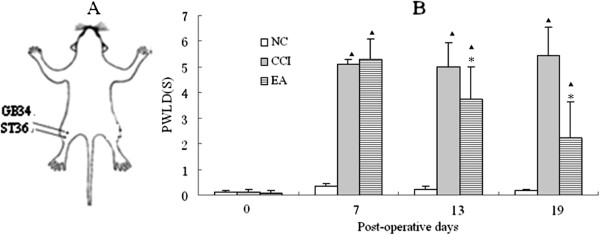
Figure 1.

Schematic locations of the acupoints in rats and effects of EA on pain threshold (A) Schematic locations of the acupoints in rats, (B) Effects of EA on PWLD in rats of the NC, CCI and EA groups (n = 20 per group). PWLD was recorded before CCI, and on day 7,13 and 19 after CCI. Data are presented as mean ± SD. ▲P < 0.05, compared with the NC group; * P < 0.05, compared with the CCI group.
