
Figure 3.
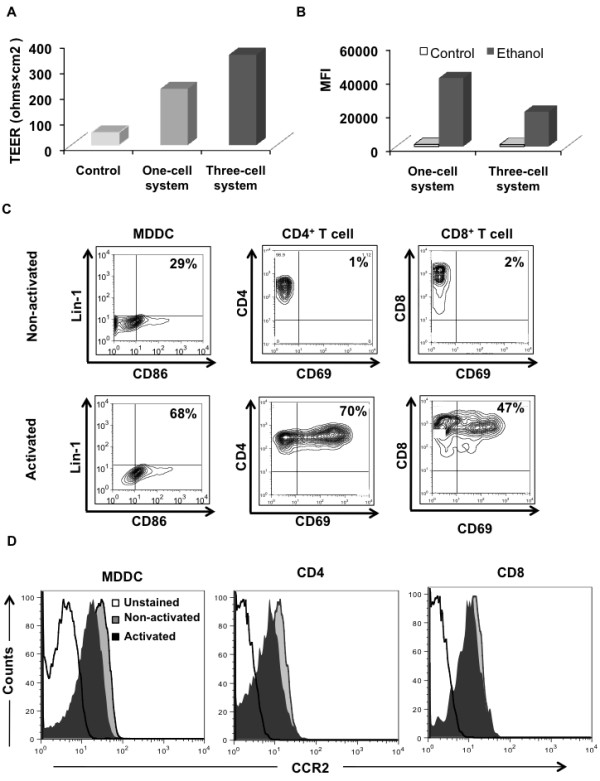
Immature monocyte-derived dendritic cells express higher CCR2 levels compared with CD4+ and CD8+ T cells. (A) Transendothelial electrical resistance measured from both the one-cell and three-cell systems. (B) Blood–brain barrier (BBB) permeability following ethanol treatment. Data are representative of at least two independent experiments. (C) Nonactivated (top panel) or activated (bottom panel) cells were surfaced-stained with appropriate antibodies as described and analyzed by flow cytometry. Thirty thousand events were gated to include the Lin-1–, CD4+, and CD8+ populations for monocyte-derived dendritic cells (MDDCs) and T cells, respectively, and were then analyzed for the specific activation markers (that is, CD86 for MDDCs and CD69 for T cells) by flow cytometry. Numbers represent the percent positive population. (D) Nonactivated and activated MDDCs and peripheral blood lymphocyte (PBLs) were gated for their respective markers and then analyzed for the surface expression of chemokine ligand 2 receptor (CCR2) by flow cytometry. Phenotyping analyses are representative of cells obtained from at least three donors.