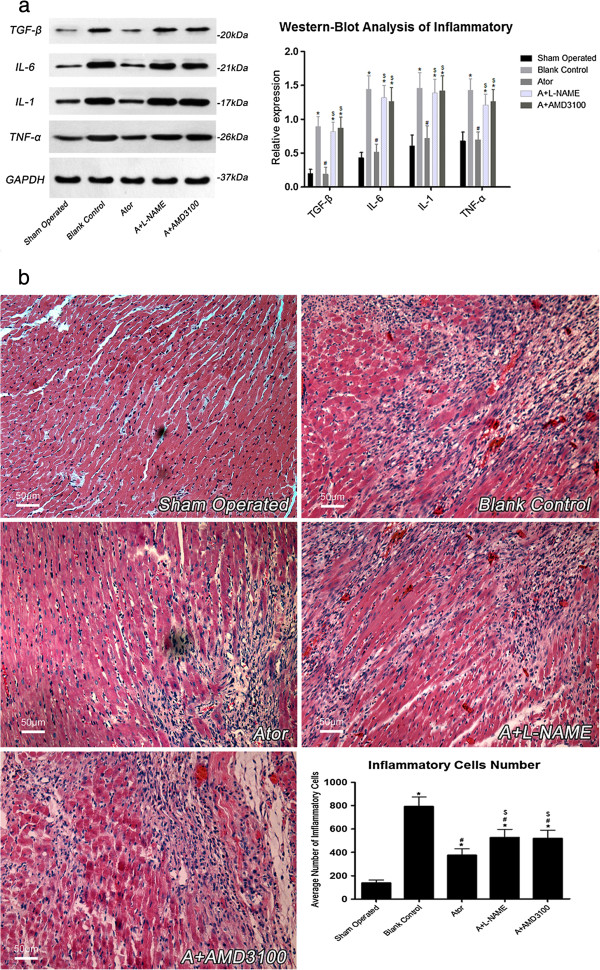
Figure 2.
Panel (a) and (b), 7 days after AMI, inflammatory cytokines expression atorvastatin treated group was significantly diminished when compared with group B. Meanwhile, the number of inflammatory cells infiltration was also concomitantly reduced in atorvastatin treated groups. And the effects of anti-inflammation by atorvastatin treatment were abrogated by L-NAME or AMD3100, as demonstrated by that both the expressions of inflammatory cytokines and the number of inflammatory cells were significantly reduced in group A than group A+L-NAME and group A+AMD3100. TGF-β (S: 0.18±0.06, B: 0.89±0.15*, A: 0.26±0.09*#, AL: 0.82±0.10*$, AA: 0.87±0.16*$), IL-6 (S: 0.40±0.08, B: 1.44±0.20*, A: 0.58±0.11*#, AL: 1.32±0.18*$, AA: 1.26±0.21*$), IL-1 (S: 0.56±0.13, B: 1.46±0.23*, A: 0.75±0.18*#, AL: 1.39±0.20*$, AA: 1.42±0.22*$), TNF-α (S: 0.63±0.10, B: 1.43±0.17*, A: 0.77±0.11*#, AL: 1.21±0.16*$, AA: 1.26±0.18*$). Inflammatory cells number (S: 137.2±26.4, B: 792.1±81.7*, A: 375.3±55.4*#, AL: 527.5±69.1*#$, AA: 516.3±71.4*#$). (*: P<0.01 vs. group S, #: P<0.01 vs. group B, $: P<0.01 vs. group A). All the measurements were repeated for 3 times to figure out the arithmetic average. S=Sham operated group; B=Blank control group; A=Atorvastatin group; AL=Atorvastatin+L-NAME group; AA=Atorvastatin+AMD3100 group.

