
Figure 7.
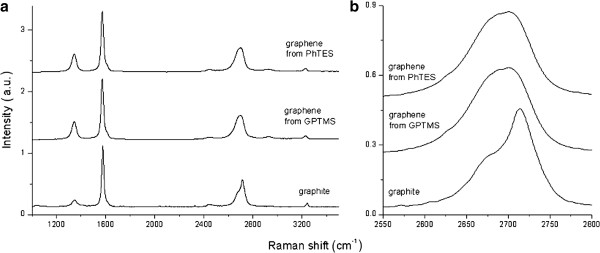
Raman analysis. Spectra of graphene obtained by sonication in PhTES and GPTMS from 5 wt.% of the initial graphite compared with graphite (a). 2D peaks evaluation for this systems (b).
Official websites use .gov
A
.gov website belongs to an official
government organization in the United States.
Secure .gov websites use HTTPS
A lock (
) or https:// means you've safely
connected to the .gov website. Share sensitive
information only on official, secure websites.
Raman analysis. Spectra of graphene obtained by sonication in PhTES and GPTMS from 5 wt.% of the initial graphite compared with graphite (a). 2D peaks evaluation for this systems (b).