Figure 3.

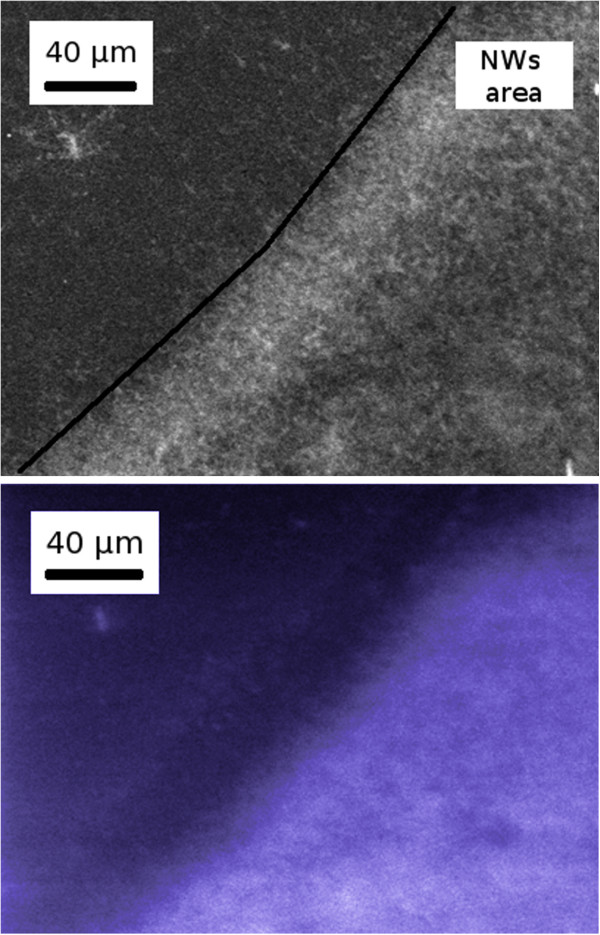
SEM image and panchromatic CL image. SEM image (top) and panchromatic CL image (false color, bottom) acquired at low magnification (×500) at the edge of the NW area. The black line is a guide for the eye along the edge of the NW area.

SEM image and panchromatic CL image. SEM image (top) and panchromatic CL image (false color, bottom) acquired at low magnification (×500) at the edge of the NW area. The black line is a guide for the eye along the edge of the NW area.