
Figure 6. TAIL results predicted auditory perception.
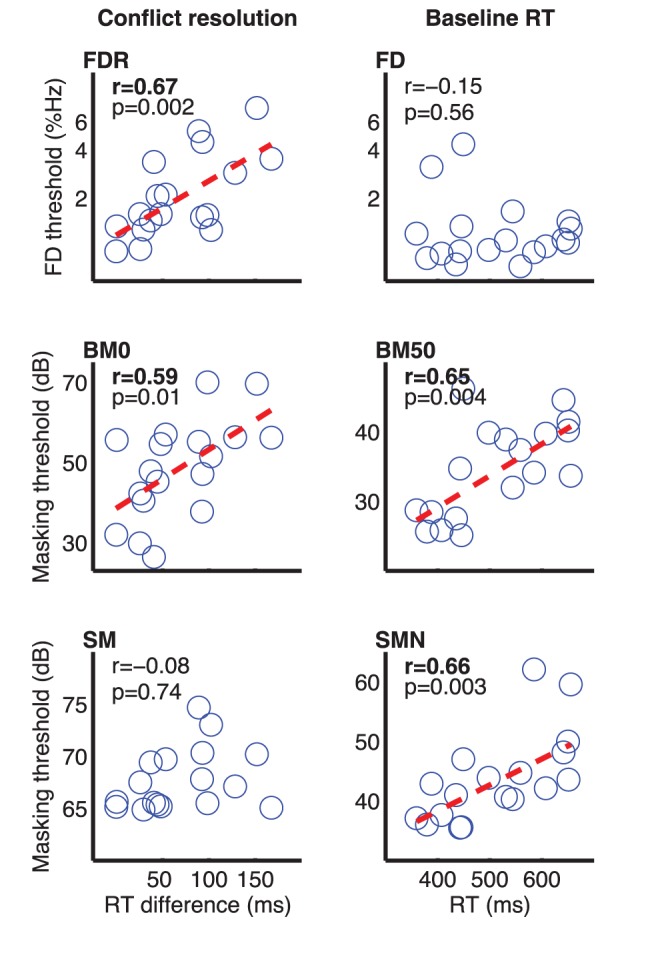
Correlations between conflict resolution (left column) and baseline RT (right column) with Frequency Discrimination (top row), Backward Masking (middle row), and Simultaneous Masking (bottom row). A fitted regression line (red dashed) was plotted only for the significant correlations.