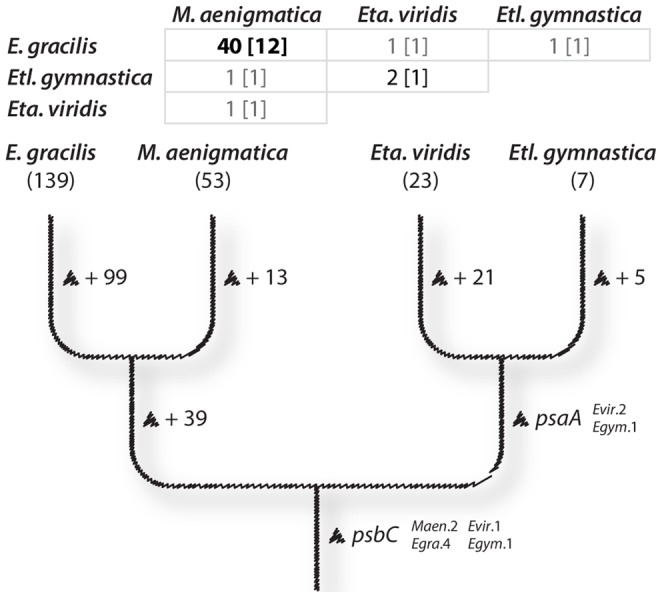
Figure 3. Phylogenetic mapping of intron insertion sites among euglenid chloroplast genomes.

At the top is a matrix showing the number of insertion sites shared between pairwise taxa (shared twintron insertions sites are indicated between brackets). At the bottom is a cladogram showing the distribution of shared intron insertion sites across the euglenids. The total number of insertion sites for each species is indicated between parentheses below its name. Insertions across the phylogenetic tree are denoted by triangles. For this analysis, the ambiguous rpoB intron insertion sites were considered distinct. The no-longer-photosynthetic E. longa was not included in this figure due to its many gene losses. The phylogenetic relationships described here are schematized from Kim et al. [21].
