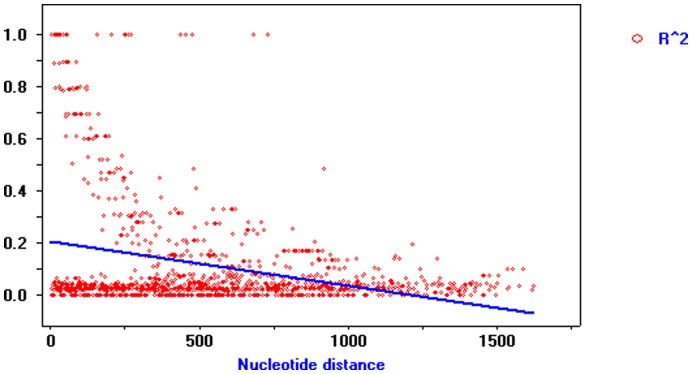
Figure 3. Decay of linkage disequilibrium within PtGA20Ox.
Pairwise correlations between SNPs are plotted against the physical distance between the SNPs in base pairs. The straight line describes the least-squares fit of r 2 (Er2) to its expectation. Linkage disequilibrium decays drastically within 500 bp.

