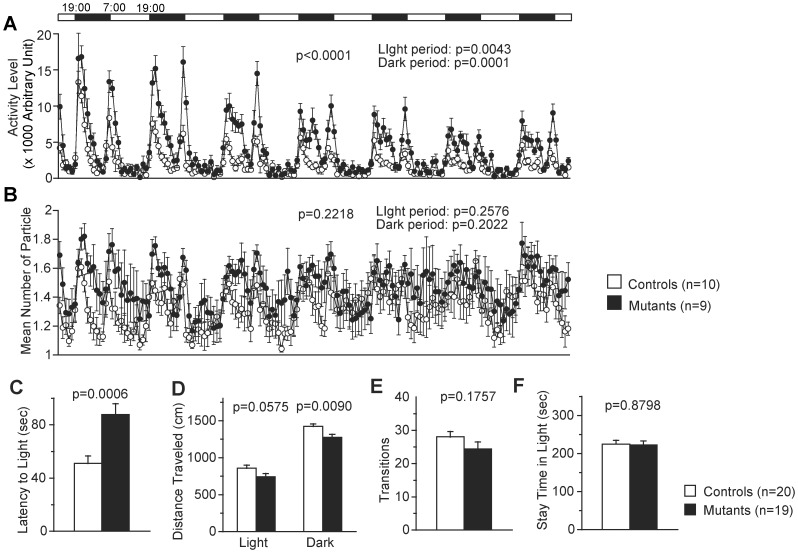
Figure 3. 24-h homecage monitoring test and light/dark transition test.
(A, B) 24-h homecage monitoring test: two mice of the same genotype were housed in a single cage and continuously monitored by a video camera. The activity level of the mutant mice was significantly higher (A), but the mean number of particles, which represented the social interaction level between cagemates, was not significantly different (B). Top bar indicates light/dark cycle. (C–F) Light/dark transition test: latency to enter the light chamber for the first time was significantly longer in the mutant mice (C), the mutant mice traveled shorter distances particularly in the dark chamber (D), no significant difference was observed in the number of transitions between the light and dark chambers (E) or in the time spent in the light chamber (F).

