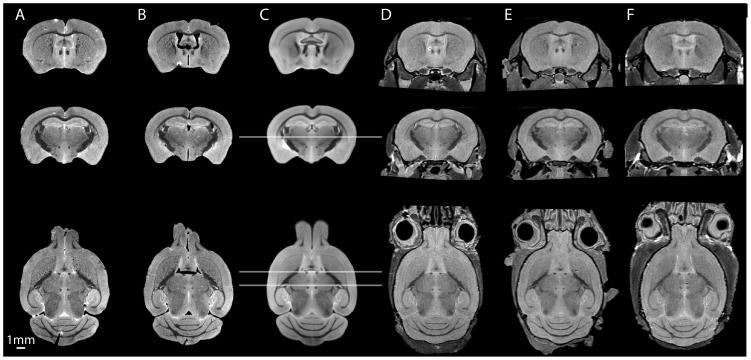
Figure 2. Illustrative examples of images from the library.
Columns A-B: WT and R6/2 (CAG250) brains. Column C: atlas image for comparison (see text for details). Columns D-F: in-skull images of WT, R6/2 (CAG250) and YAC128 brains. Horizontal lines in C indicate coronal section positions (bregma −0.8 mm, −1.5 mm, the horizontal slice is taken at bregma 2.8 mm). Note the damaged areas of the ex-skull brains, for example at the olfactory bulbs, and the cerebellar tearing.

