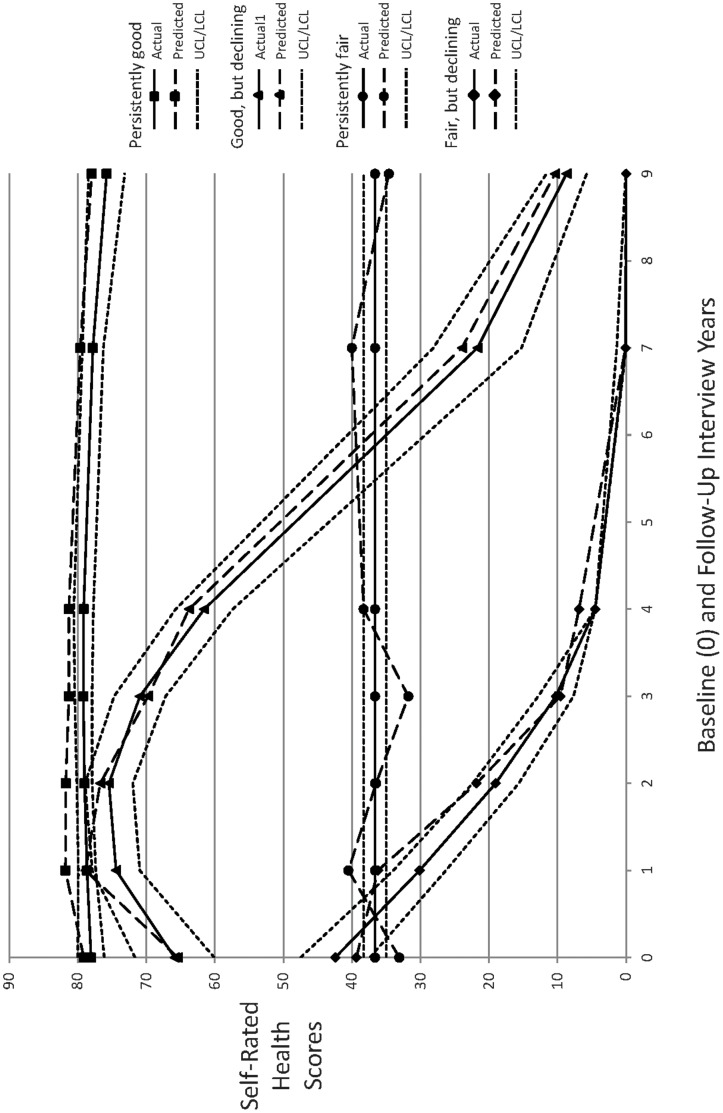
Figure 1. Graphic Portrayal of the Four Identified Self-Rated Health Trajectory Groups.
The horizontal axis reflects the baseline (0) and (one-, two-, three-, four, seven-, and nine-year) follow-up interviews and the vertical axis reflects the self-rated health scores. The solid lines for the group trajectories reflect the observed means of the self-rated health scores, the long-dashed lines for the group trajectories reflect the predicted mean self-rated health scores, and the short-dashed lines reflect the upper and lower 95% confidence intervals around those predicted self-rated health trajectories. The persistently good self-rated health trajectory group (N = 537) is indicated with squares, the good but declining self-rated health trajectory group (N = 116) is indicated by triangles, the persistently fair self-rated health trajectory group (N = 267) is indicated by circles, and the fair but declining self-rated health trajectory group (N = 78) is indicated by diamonds.

