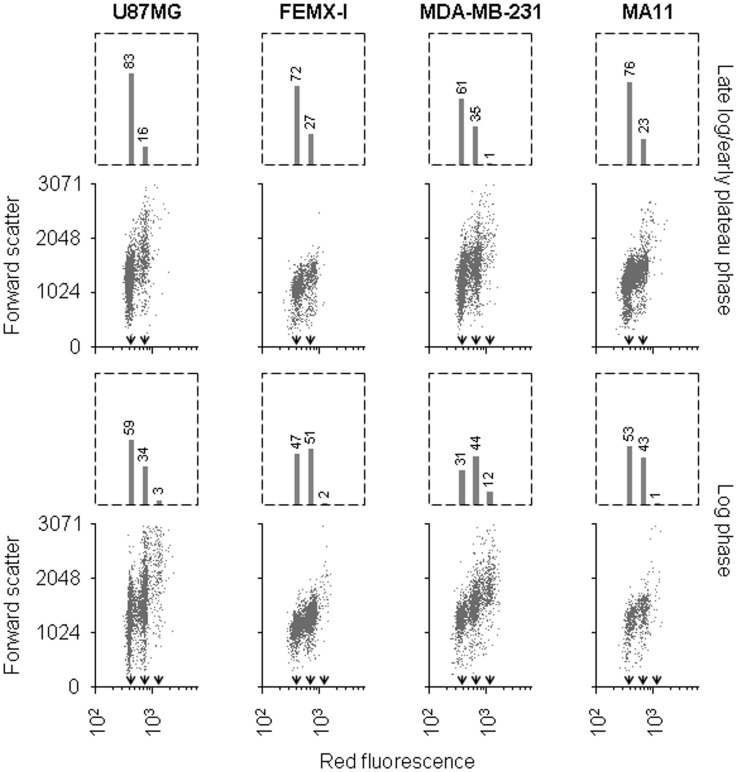
Figure 1. Detection in human tumor cell lines of cells containing four-fold DNA amount.
Flow cytometric analysis of cultures of the tumor lines U87MG, FEMX-I, MDA-MB-231, and MA11, at either low (top panels) or high (bottom panels) rate of proliferation, showing the distribution of cells according to DNA content, expressed as intensity of red fluorescence, and forward scatter (arbitrary units); the bar graph on top of each panel shows the percentage of cells in the G0/G1 peak (lowest DNA amount per cell), and that of cells with 2- (including cells in S phase), and 4-fold the intensity of the cells of the G0/G1 peak. The average fluorescence of each of the three populations is indicated by arrowheads. In all the cell lines, a greater number of cells with four-fold DNA quantity is present in the rapidly proliferating culture, representing 3%, 2%, 12%, and 1% of the total cells for U87MG, FEMX-I, MDA-MB-231, and MA11, respectively.

