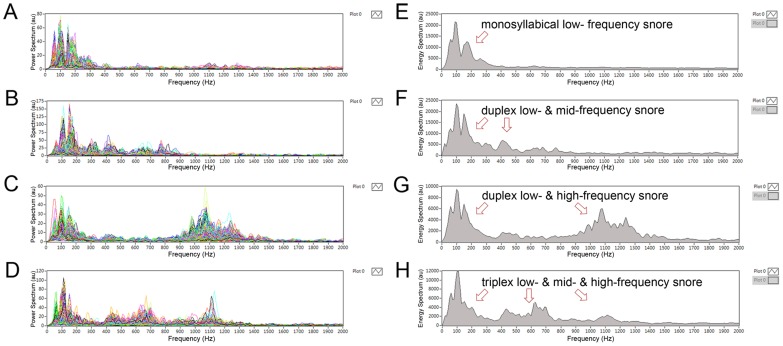
Figure 1. Spectral analyses of full-night snoring sounds including power spectra of overall snore events (A–D) and energy spectrum of an overnight snore map (E–H).
(A) & (E) Primarily monosyllabical low-frequency snoring (type 1 snore map). (B) & (F) Duplex low- and mid-frequency snores (type 2). (C) & (G) Duplex low- and high-frequency snoring (type 3). (D) & (H) Triplex low-, mid-, and high-frequency snores (type 4).

