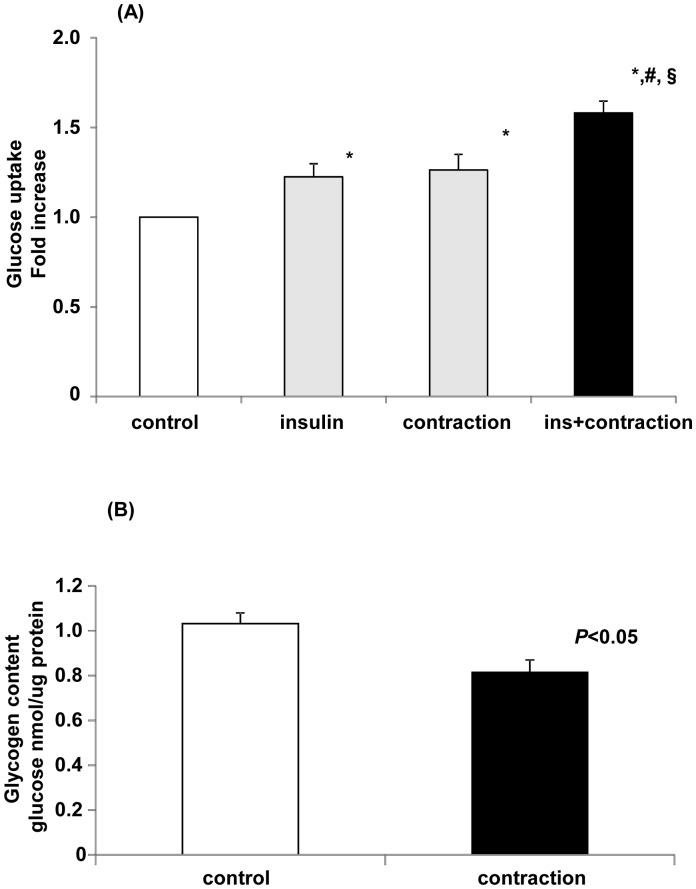
Figure 6. Electrical stimulation induces increased glucose uptake and decreased glycogen content in C2C12 myotubes.
(A) Glucose uptake in C2C12 myotubes after contraction. C2C12 myotubes were stimulated by insulin (20 mU/mL), electric pulses, or electric pulses in the presence of insulin in KRB for 1 h, after which 2-deoxy-D-glucose transport was measured. The control was incubated for 1 h at 37°C without stimulation. Data are mean ± S.E.M, n = 8/group. Data were analyzed using one-way ANOVA followed by Student-Newman-Keuls post hoc test, with p<0.05 considered statistically significant. *significant compared to the control; #significant compared to insulin alone; §significant compared to stimulation alone. (B) Glycogen concentration in C2C12 myotubes after stimulation by electric pulses. C2C12 myotubes were stimulated by electric pulses (50 V, 1 Hz, 3 ms) for 1 h at 37°C. Glycogen concentration is shown as the glucose concentration per µg of protein. The glycogen concentration in contracted C2C12 myotubes was significantly reduced. Data are shown as mean ± S.E.M., n = 5–7.

