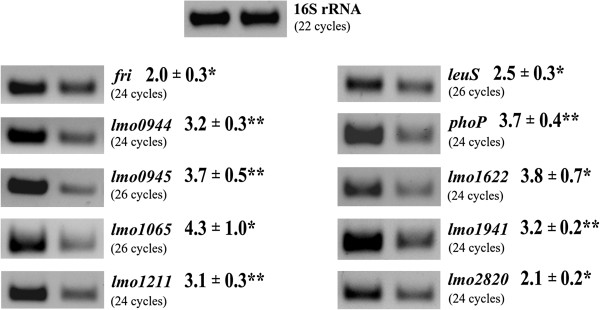
Figure 2.
Transcriptional analysis of gene expression under penicillin G pressure using RT-PCR. Total RNA was isolated from exponential-phase cultures of L. monocytogenes EGD grown in BHI broth at 37°C without antibiotics (right) or in the presence of penicillin G at a concentration of 0.09 μg/ml for 30 min (left). The RNA was used as the template in RT reactions with p(dN)6 random primers and the obtained cDNAs were then used in PCRs with a panel of gene-specific primer pairs. All PCRs were performed three times using cDNAs transcribed from three separate RNA preparations, with similar results. In all cases, control PCRs were performed to confirm the complete removal of DNA from the RNA preparations prior to reverse transcription (data not shown). The RT-PCR products were quantified by measuring the level of band fluorescence using ImageQuant software and these values were normalized to those of a 16S rRNA gene fragment amplified in control reactions. The numbers given are the relative amounts of the RT-PCR products obtained for the studied genes using a template of total RNA isolated from wild-type L. monocytogenes EGD grown in the presence of penicillin G in comparison with the corresponding amounts for this strain grown without antibiotics. Asterisks indicate significant differences according to Student’s t test (*, P < 0.05; **, P < 0.01).

