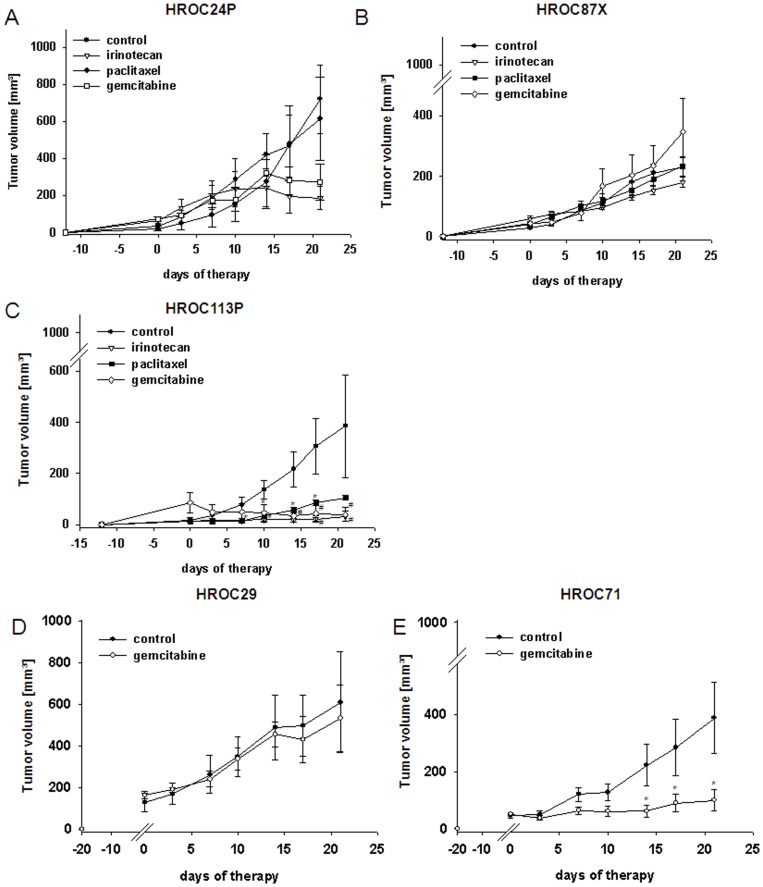
Figure 6. In vivo tumorigeneicity & response to selected chemotherapeutics.
NMRI nu/nu mice either received s.c. injections of established MMR-D cell lines (5 Mio. cells/mouse; A–C) or were s.c grafted with HROC29 and HROC71 tumor fragments (D, E). For analyzing in vivo drug response, mice with established (A) HROC24, (B) HROC87 or (C) HROC113 tumors were treated with irinotecan, paclitaxel or gemcitabine (i.p.; 20 mg/kg bw each, n = 6−7 mice per group). HROC71 and HROC29 xenografts were given gemcitabine (i.p.; 20 mg/kg bw, n = 5−6 mice per group). Therapeutic regimens consisted of six injections in total, applied twice a week. Control animals received equivalent volumes of saline (n = 6−7). Values of are given as mean ± SEM. *p<0.05 vs. control, U-Test; #p<0.05 vs. control, t-test.

