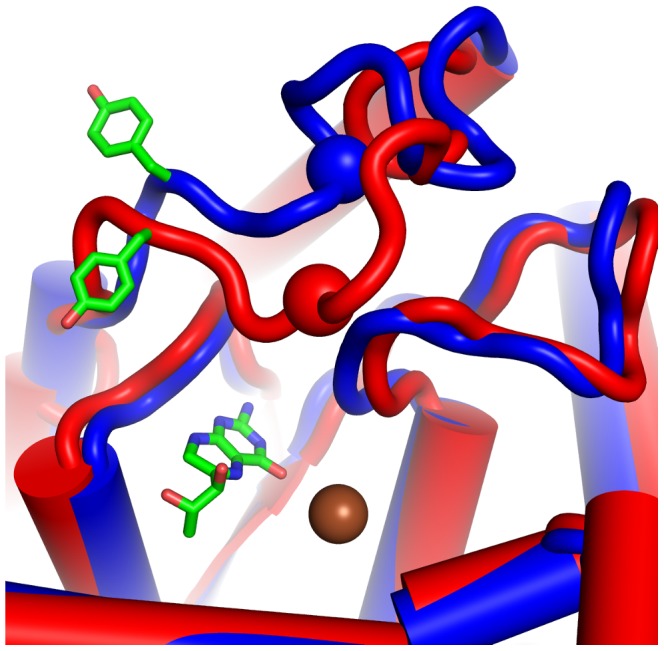
Figure 4. Changes in the active site of phenylalanine hydroxylase introduced by side chain oxidation.

Starting coordinates of both simulations (blue cartoon) overlaid with an average structure of the time frames 150–160 ns of standard MD simulation PAHox (red cartoon). The pronounced loop movement towards the catalytic center (iron ion as brown sphere, co-factor as sticks) was measured as distance of the Cα-atom of Glu141 (red and blue sphere respectively) to the catalytic iron (brown). This rearrangement is paralleled by a reorientation of Tyr138 (shown as sticks, left), in turn concertedly blocking access to the active site of PAHox.
