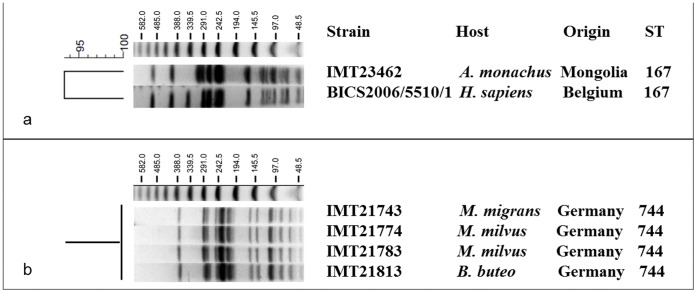
Figure 1. Dendrogram showing (A) the relationship of one avian ESBL-E. coli isolate and a human clinical isolate [39], both of ST167, and (B) PFGE profiles of four avian ST744 ESBL-E. coli isolates based on XbaI restriction calculated with Bionumerics 6.6 (Applied Maths, Belgium).
ST = sequence type; A. = Aegypius; B. = Buteo; H. = Homo; M. = Milvus, A size marker (Lambda Ladder PFG Marker; New England Biolabs GmbH, Frankfurt a. M., Germany) with respective fragment sizes (kb) is given on top of the agarose gel.

