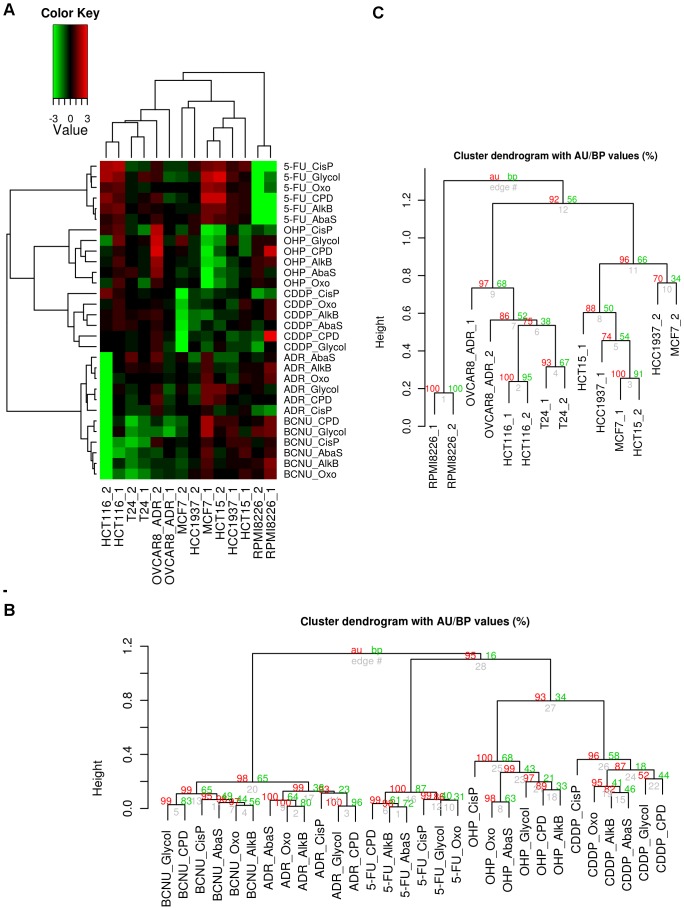
Figure 2. Analysis of the DNA repair response of the cell lines across treatments and lesion types.
A. The heatmap was constructed using the log2 transformed ratios of the fluorescence intensity obtained for repair of each lesion between treated and non-treated cell lines (log2(T/NT)). Hierarchical clustering algorithm with correlation dissimilarity measure was used to group in a colour-coded grid the seven cell lines from the two experiments and the five treatments by lesion type repair, in the two dimensions. In the first dimension, cell lines were clustered by similarity of their DNA repair response profile covariation across the impact of the five treatments by lesion type repair. In the second dimension, treatments by lesion type repair were clustered by similarity of their pattern covariation across the seven cell lines from the two experiments. To evaluate the consistency between the two independent experiments, Set_1 and Set_2 data were kept separated and analyzed simultaneously (marked _1 and _2 respectively). In the colour-coded grid, values greater than 0 are shaded in red indicating stimulation of repair activities whereas values below 0 are coloured in green indicating an inhibition of repair activities, compared to NT cells. Values greater than 0 were shaded in red indicating stimulation of repair activity, while values below 0 were shaded in green indicating inhibition of repair activity. Values around 0 were coloured in black indicating no detected effect. Brightness of colour was correlated with the magnitude of effect of treatments on the DNA repair activities. B. Dendrogram of the five treatments by lesion type repair with clusters significance values. C. Dendrogram of the seven cell lines from the two experiments with clusters significance values. P-values (AU (Approximately Unbiased) P value in red and BP (Bootstrap Probability) P value in green) are reported on the dendrograms.

