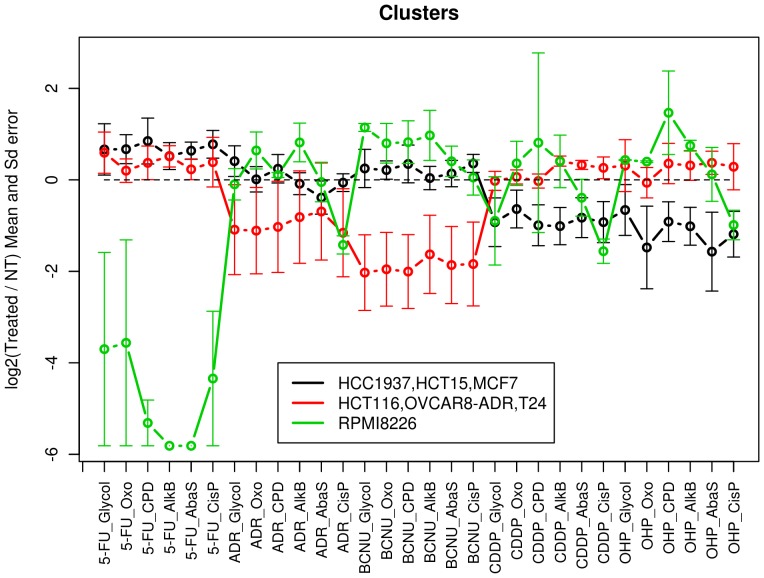
Figure 3. Characteristics of the 3 cell line clusters identified.
Means and standard errors of the three identified classes of cell line responses across the five treatments and the six lesion types were calculated using the log2(T/NT) data (black line: HCC1937, HCT-15, MCF7; red line: HCT-116, OVCAR-8/ADR, T24; green line: RPMI8226).

